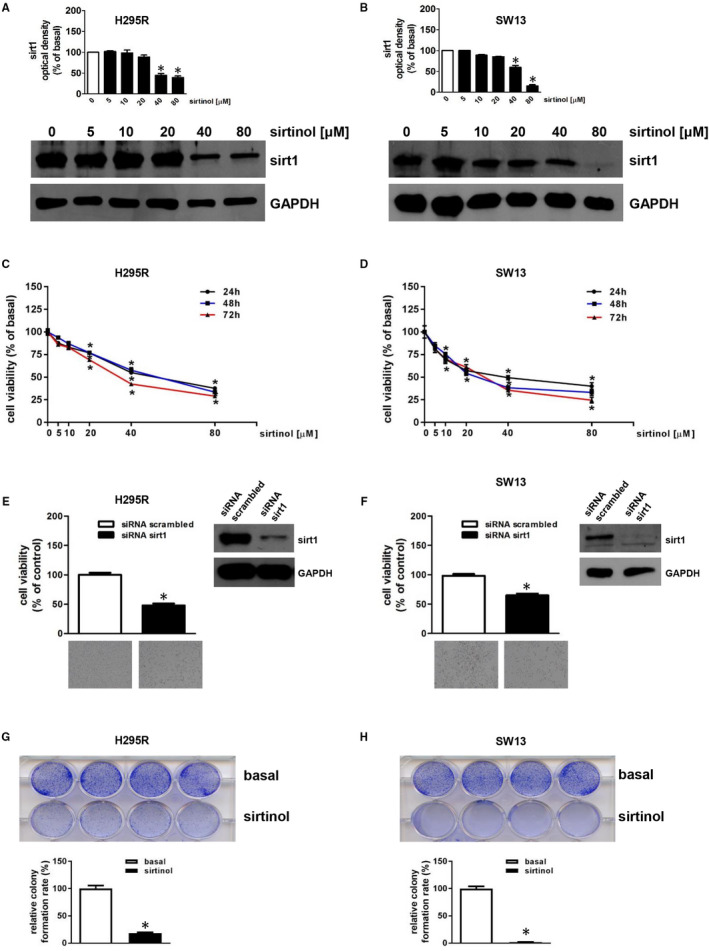
FIGURE 1.

Sirtinol or sirt1 gene silencing reduce H295R and SW13 cell growth. (A,B) H295R (A) or SW13 (B) cells were untreated (0) or treated with increasing doses (5; 10; 20, 40, 80 μmol/L) of sirtinol for 24 h. Total protein extracts were examined by Western blotting analysis for sirt1 expression; GAPDH was used to normalize protein expression. Blots are from one experiment representative of three with similar results. H295R (C) or SW13 (D) cells were untreated (0) or treated with increasing doses (5; 10; 20, 40, 80 μmol/L) of sirtinol for 24, 48 and 72 h. Cell viability was evaluated by MTT assay (*P < .05 vs 0). (E,F) MTT assay was performed on H295R (E) or SW13 (F) cells transfected for 72 h with control siRNA (siRNA scrambled) or with siRNA for sirt1 (siRNA sirt1). Results were expressed as mean ± SE of three separate experiments (*P < .05 vs siRNA scrambled). The insert in E or F illustrates a Western blot of proteins from H295R or SW13, respectively, assessing the expression of sirt1 in the presence of siRNA scrambled or siRNA sirt1. GAPDH was used to normalize protein expression. Below images represent the morphological changes of H295R (E) or SW13 (F) cells after sirt1 silencing. These were observed by an Inverted Optic Microscope (magnification X100) and are from a representative experiment. (G,H) Colony formation assay was performed on H295R (G) or SW13 (H) cells (2000 cells/well) plated in the absence (basal) or presence with sirtinol (40 μmol/L). Relative colony formation rate was evaluated 14 (for H295R) or 6 (for SW13) days later (*P < .05 vs basal). Upper images are from a representative experiment
