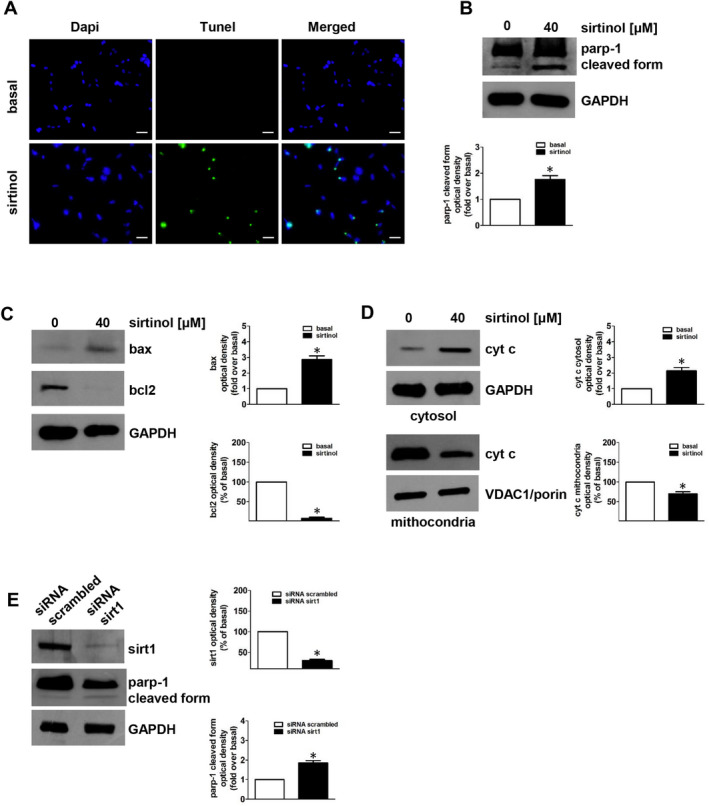
FIGURE 2.

Sirtinol or sirt1 gene silencing induce apoptosis in adrenocortical cancer cells. (A) TUNEL assay was performed on H295R cells, which were previously untreated (basal) or treated with sirtinol (40 μmol/L) for 48 h. Nuclei counterstaining was executed employing DAPI. Fluorescent signal was observed under a fluorescent microscope (magnification X200). Scale bar= 25µm. Images are from a representative experiment. (B‐D) H295R cells were treated with sirtinol (40 μmol/L) for 24 h. Parp‐1(B), bax and bcl‐2 (C) were evaluated by Western blot. (B, below panel; C right panels) Graphs correspond to means of standardized optical densities from three experiments, bars correspond to SE (*P < .05 vs basal). Results are expressed as % of inhibition or fold induction versus basal. Western blot analyses of cytochrome c (cyt c) (D) were performed on cytosolic and mitochondrial protein fractions. Blots are from one experiment representative of three with similar results. GAPDH and VDAC1/porin were used as a loading control for cytosolic and mitochondrial proteins, respectively. (D, right panels) Graphs correspond to means of standardized optical densities from three experiments, bars correspond to SE (*P < .05 vs basal). Results are expressed as % inhibition or fold induction respect to basal. (E) H295R cells were transfected for 72 h with control siRNA (siRNA scrambled) or with siRNA for sirt1 (siRNA sirt1). Parp‐1 and sirt1 were evaluated by Western blot. Blots are from one experiment representative of three with similar results. GAPDH was used to normalize protein expression. (E, right panels) Graphs correspond to means of standardized optical densities from three experiments, bars correspond to SE (*P < .05 vs basal). Results are expressed as % inhibition or fold induction respect to basal
