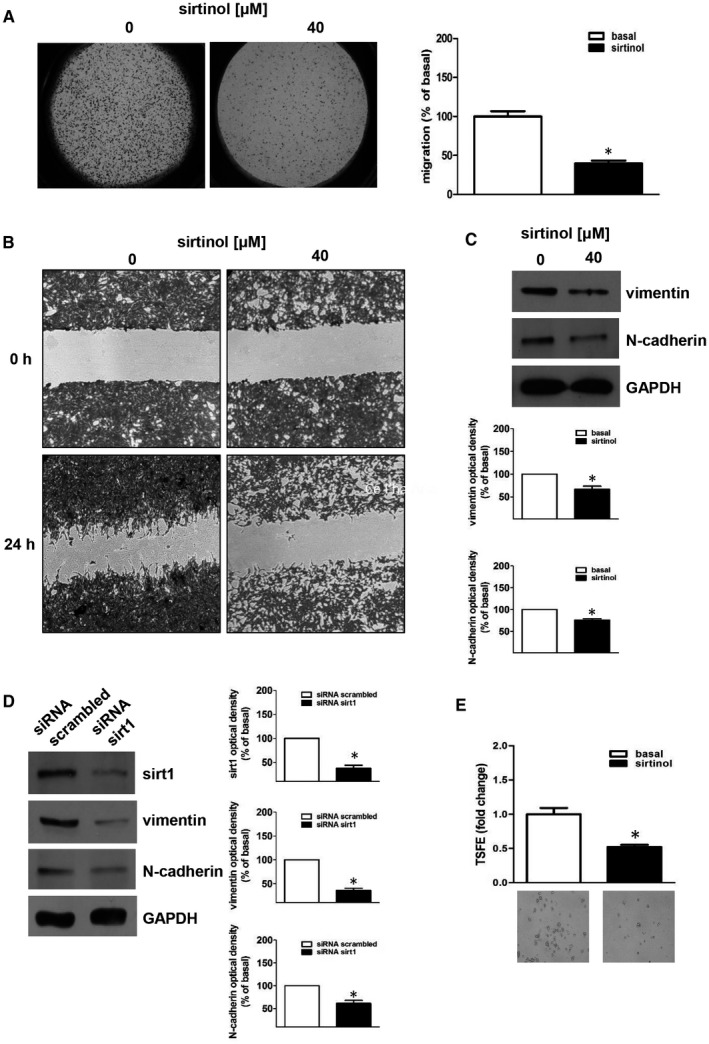
FIGURE 3.

Sirtinol or sirt1 gene silencing inhibit H295R migration and invasion. (A, B) H295R cells were untreated (basal, 0) or treated with sirtinol (40 μmol/L) for 24 h. Transwell migration (A) and wound healing (B) assays were performed as described in ‘Materials and Methods’. Images are from a representative experiment (A, magnification X20; B, magnification X100). (A) In the transwell migration assay, sirtinol was added in the lower compartment. After 24 h of incubation, migrated cells to the lower surfaces of the membranes were observed under a microscope and then counted. Right graph represents the mean ± SE of three independent experiments of migrated cells number expressed setting untreated cells as 100% (basal) (*P ≤ .05 vs basal). (C,D) Western blot analyses of vimentin, N‐cadherin and sirt1 were executed on H295R cells, which were previously untreated (0) or treated with sirtinol (40 μmol/L) for 24 h (C) or transfected for 72 h with control siRNA (siRNA scrambled) or with siRNA for sirt1 (siRNA sirt1) (D). Blots are from one experiment representative of three with similar results. GAPDH was used to normalize protein expression. (C, below panels; D, right panels) Graphs correspond to means of standardized optical densities from three experiments, bars correspond to SE (*P < .05 vs basal). Results are expressed as % inhibition respect to basal. (E) H295R cells were plated on low‐attachment plates and then left untreated (basal) or treated with sirtinol (40 μmol/L). Tumour spheres formation efficiency (TSFE) was evaluated 5 d later (*P < .05 vs basal). Images below graphs are from a representative experiment (magnification X200)
