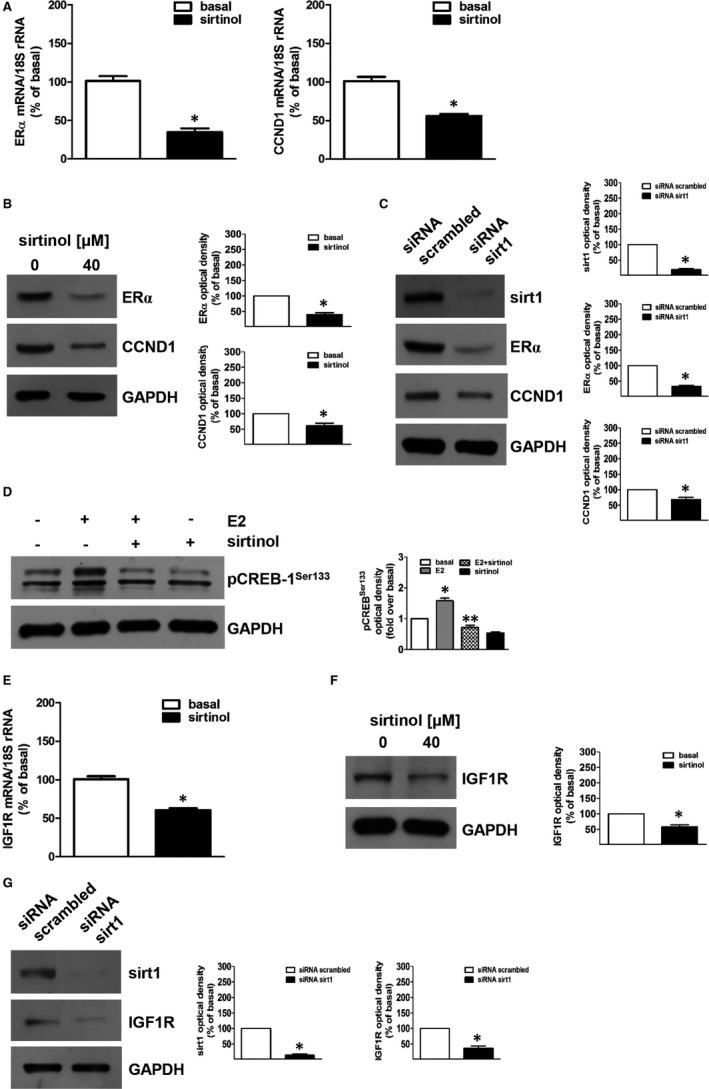
FIGURE 4.

Sirtinol or sirt1 gene silencing inhibit ERα expression and oestrogen‐dependent pathways. (A,E) H295R cells were untreated (basal, 0) or treated with sirtinol (40 μmol/L) for 24 h. The mRNA was extracted and analysed by real‐time RT‐PCR. Gene expression of ERα and cyclin D1 (CCND1) (A) or IGF1R (E) in every sample was standardized to 18S rRNA content. N‐fold differences of gene expression compared to calibrator (untreated sample) were used to graph final results. Data correspond to mean ± SE of values from at least three separate RNA samples (*P < .05 vs calibrator). (B,F) H295R cells were untreated (basal, 0) or treated with sirtinol (40 μmol/L) for 24 h. Total protein extracts were analysed by Western blot analysis for the expression of ERα and CCND1 (B) or IGF1R (F); GAPDH was used to normalize protein expression. Blots are from one experiment representative of three with similar results. (B,F right panels) Graphs correspond to means of standardized optical densities from three experiments, bars correspond to SE (*P < .05 vs basal). Results are expressed as % inhibition respect to basal. (C,G) H295R cells were transfected for 72 h in the presence of control siRNA (siRNA scrambled) or siRNA for sirt1 (siRNA sirt1). Total protein extracts were analysed by Western blot analysis for the expression of sirt1, ERα and CCND1 (C) or sirt1 and IGF1R (G); GAPDH was used to normalize protein expression. Blots are from one experiment representative of three with similar results. (C,G right panels) Graphs correspond to means of standardized optical densities from three experiments, bars correspond to SE (*P < .05 vs basal). Results are expressed as % of inhibition versus basal. (D) H295R cells were untreated (−) or treated with sirtinol (40 μmol/L) for 24 h. Then, cells were treated with estradiol (E2) (100 nmol/L) for 1 h as indicated. Total protein extracts were analysed by Western blot analysis for the expression of pCREB‐1Ser133; GAPDH was used to normalize protein expression. Blots are from one experiment representative of three with similar results. (D, right panel). Graphs correspond to means of standardized optical densities from three experiments, bars correspond to SE (*P < .05 vs basal; **P < .05 vs E2). Folds induction versus basal or E2 were used to express results
