Fig 2.

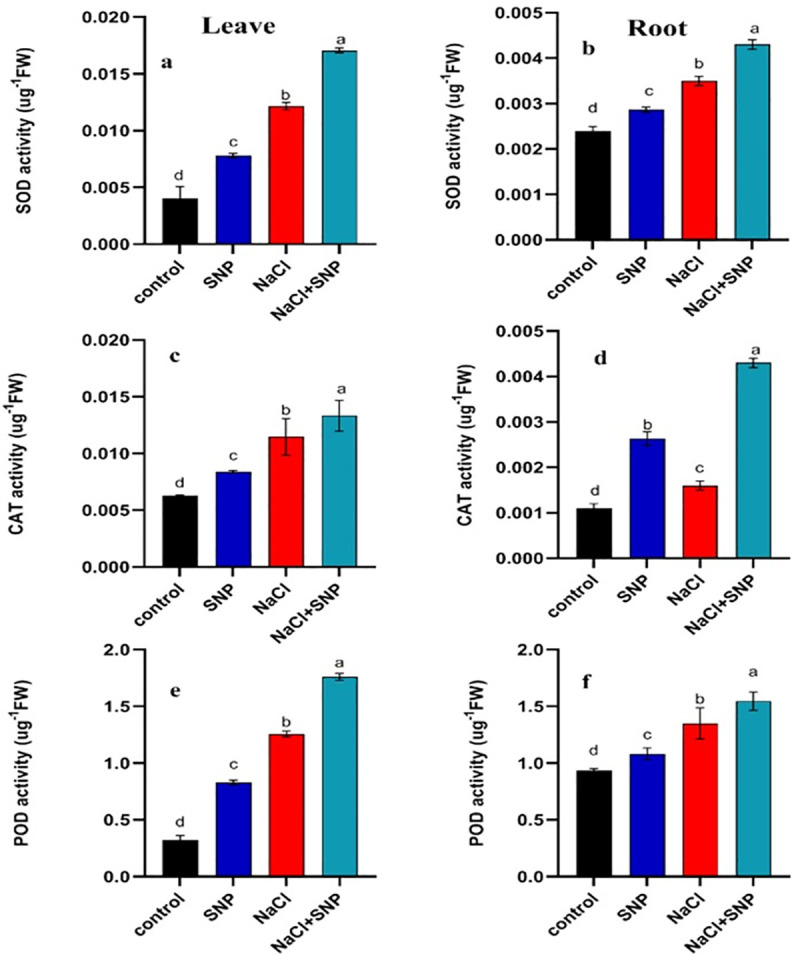
Activities of SOD, CAT and POD content in leaves (a, c, e) and roots (b, d, f) of treated and control soybean plant. Data are means ± SD calculated from three replicates.

Activities of SOD, CAT and POD content in leaves (a, c, e) and roots (b, d, f) of treated and control soybean plant. Data are means ± SD calculated from three replicates.