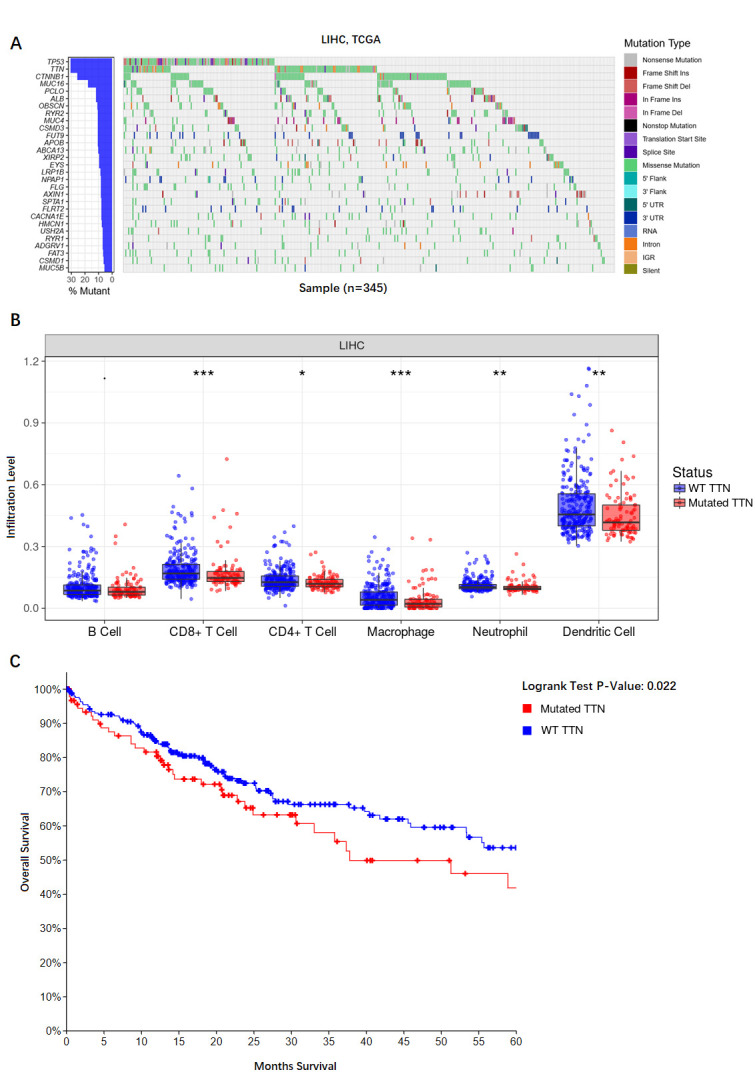
Fig 7. Identification of mutation signatures and its correlation with the immune infiltration and overall survival.

(A) Heatmap representation of the distribution of driver genes mutations in patients, (B) The immune signatures (CD8+ T cells, Macrophage, Neutrophil, and Dendritic Cells) show significantly higher enrichment levels in TTN- wildtype than in TTN- mutated cancers in LIHC, (C) Kaplan-Meyer survival curves showed that TTN mutation have a negative correlation with OS in LIHC.
