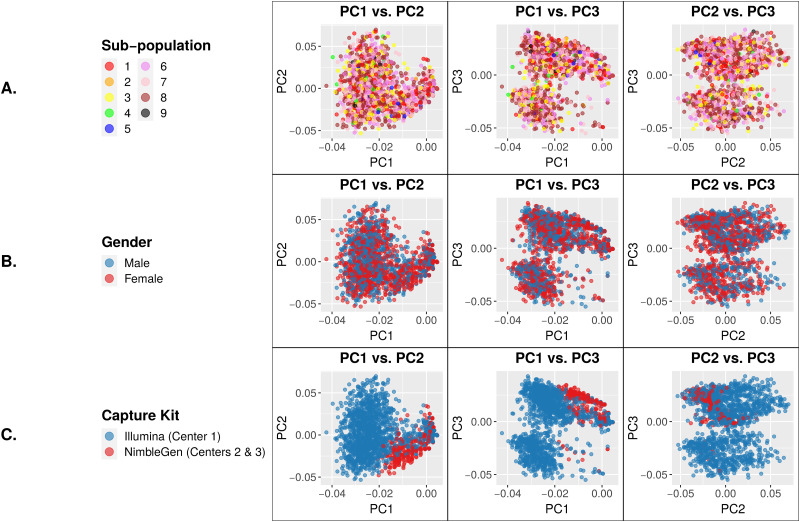
Fig 3. PC eigenvector plots of genotypes at 29 exome-wide significant SNPs.
Each data point represents a single individual. Clustering of samples for a particular variable indicates genotypic similarity between individuals for the trait represented by that color. (A) PCs color coded based on sub-population. (B) PCs color coded based on gender. (C) PCs color coded based on capture kit. The NimbleGen-captured samples cluster tightly together, indicating their genotypic similarity that is distinct from the Illumina-captured samples.

