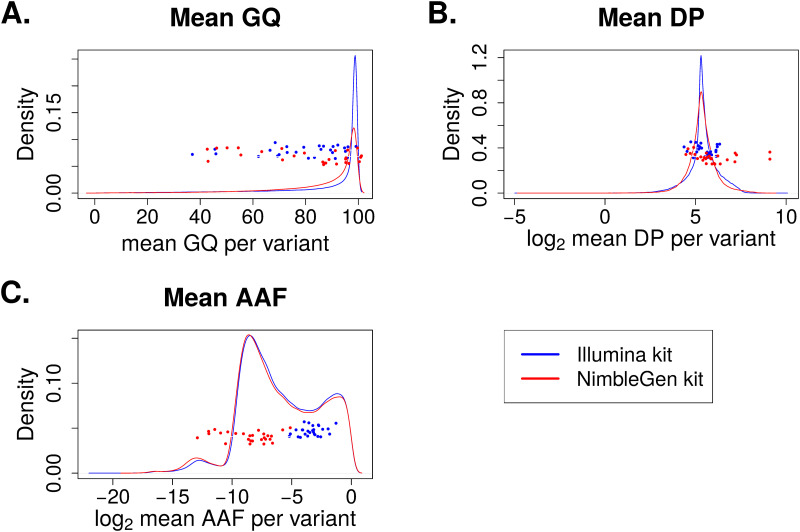
Fig 4. Density plots of variant quality parameters between two exome capture kits.
Mean values were computed across all samples for each variant. The solid lines show the distributions of all 166,947 variants used in the association analyses, and the scattered dots represent the 29 novel SNPs. (A) Density plot for mean genotype quality (GQ). (B) Density plot for mean read depth (DP). (C) Density plot for mean alternative allele fraction (AAF).

