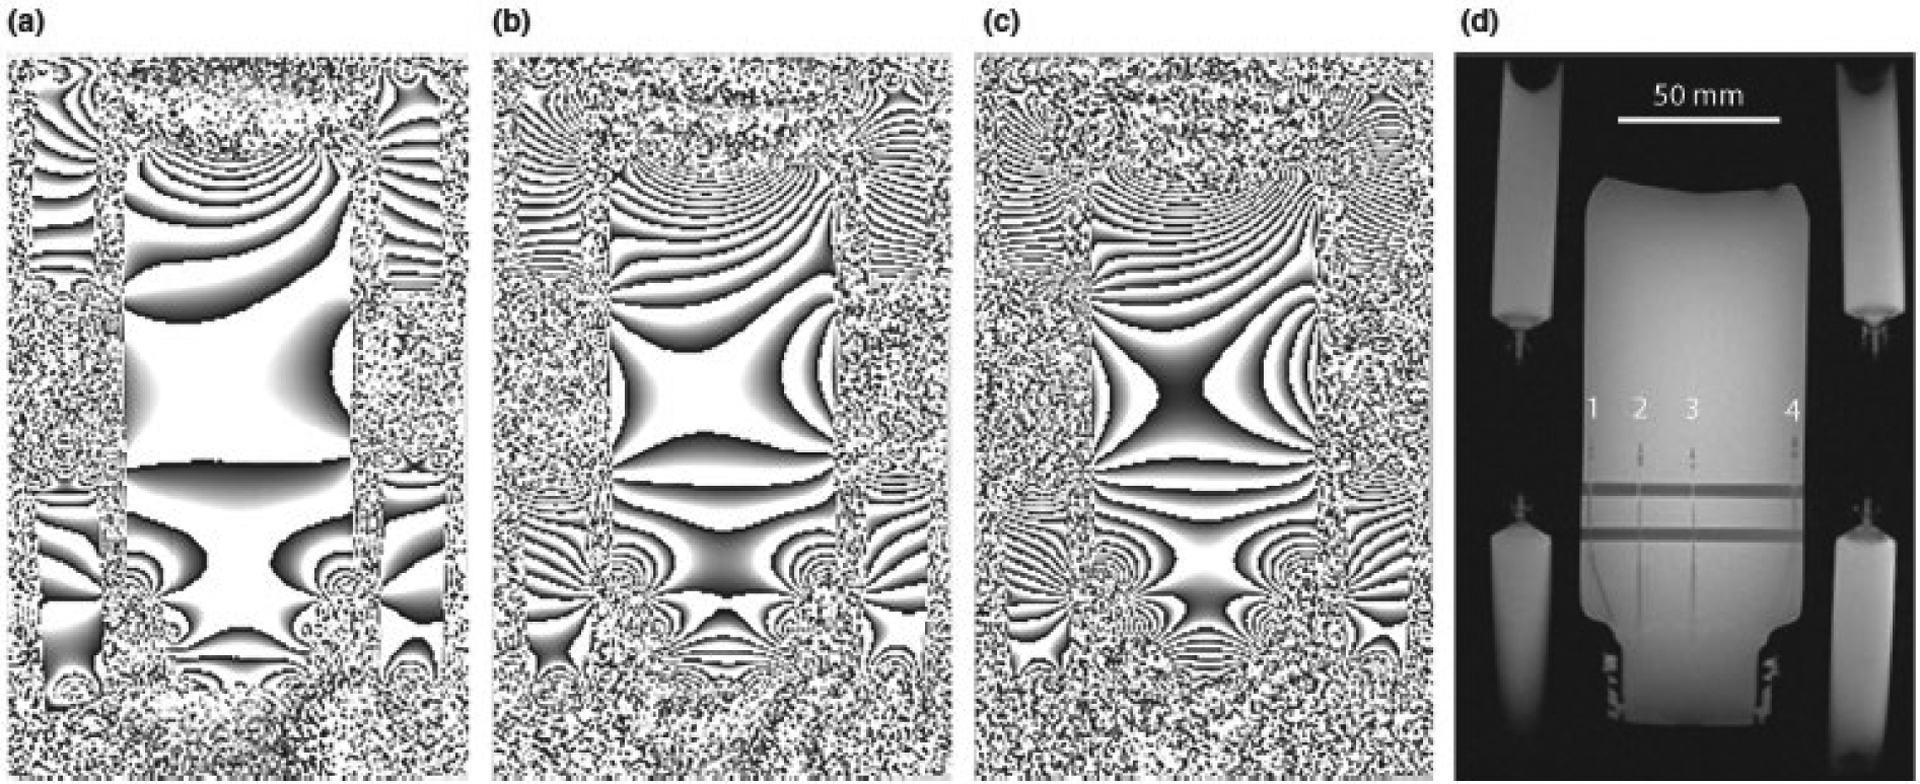
Figure 1:

Phase reconstructed images of the phantom and four reference oil vials (at the corners) acquired at TE values of (a) 8, (b) 16 and (c) 26 ms, demonstrating the significant phase wraps and signal drop-out which occurred as the TE increased. (d) Magnitude reconstructed image showing the position of the four fiber optic temperature sensors (numbered 1 – 4) and the horizontal support bars for the sensors within the phantom.
