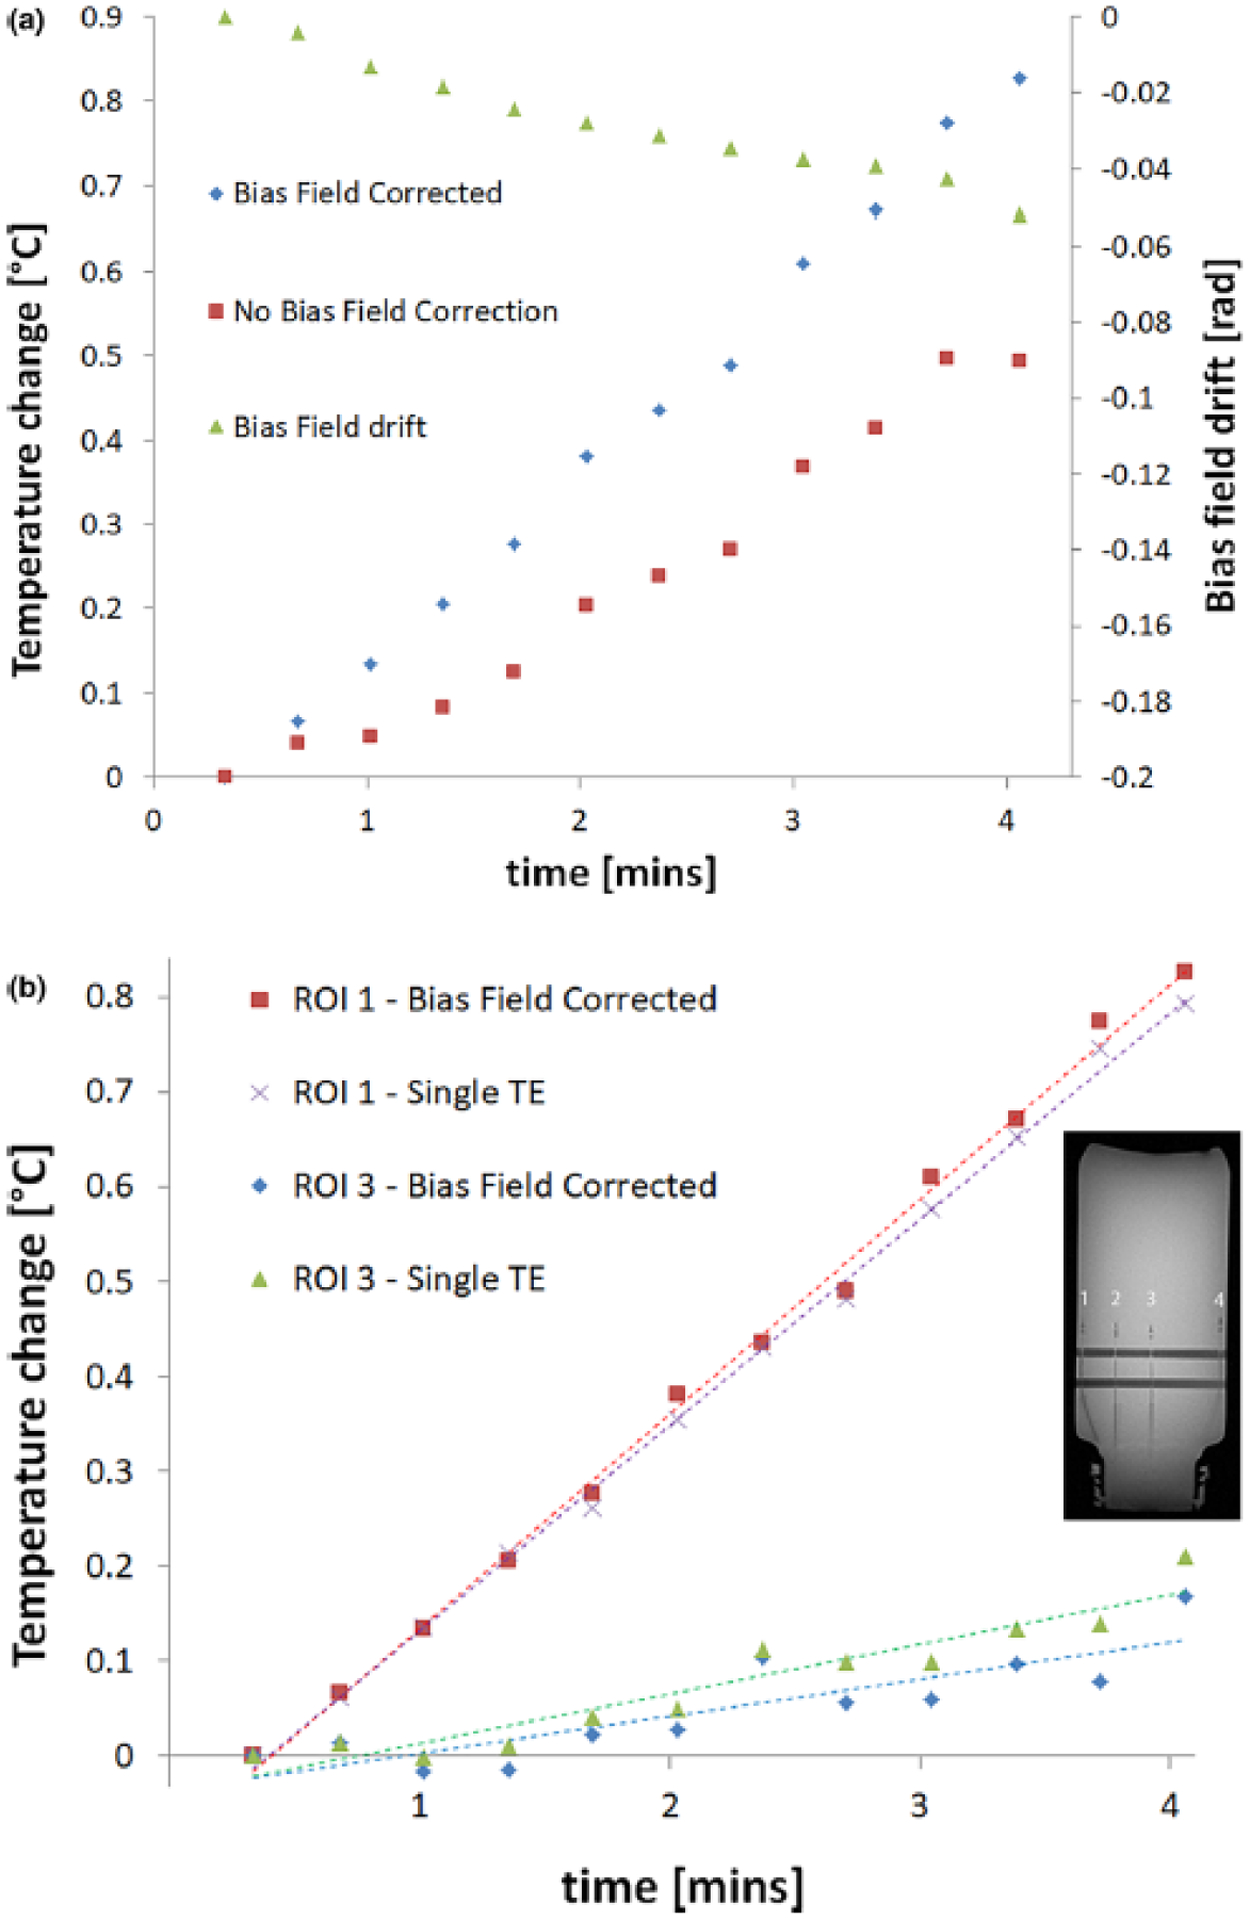
Figure 2:

Graphs showing the change in temperature as a function of time as measured via MRT in: (a) ROI 1 placed at the edge of the phantom, with and without the bias field correction applied, and (b) ROIs 1 and 3, placed at the edge and center of the phantom respectively (indicated in the image insert), with bias field correction applied in both cases but without correcting for temperature-dependent changes in tissue’s electrical properties (i.e. with a single-echo acquisition, TE = 10 ms). This correction has little effect close to the phantom’s surface (‘ROI at edge’), and only becomes important at increasing depths as illustrated by the least square fit to the data in each case.
