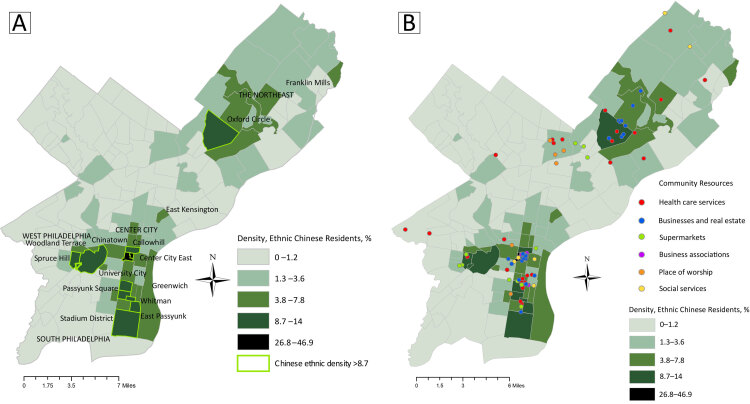
Distribution of neighborhoods and services in Philadelphia, Pennsylvania, by density of ethnic Chinese residents, from 2014–2018 estimates. Map A shows percentages by neighborhood, highlighting those with a density of 8.7% or more. Map B shows locations of 6 types of community resources for Chinese residents overlaid on Map A to illustrate resource distribution in relation to population density. Geographic proximity of resources corresponds overall to neighborhood density of Chinese residents. However, not all types of resources are equally distributed, indicating they are unavailable to residents of some neighborhoods. Data sources: Chinese demographic data are from the American Community Survey 2018 (5-Year Estimates), prepared by Social Explorer (1). Boundaries for Philadelphia neighborhoods data are from OpenDataPhilly, developed by Azavea Inc (2). Community resource data are from the Chinese Philadelphia Yellow Pages (3).

An official website of the United States government
Here's how you know
Official websites use .gov
A
.gov website belongs to an official
government organization in the United States.
Secure .gov websites use HTTPS
A lock (
) or https:// means you've safely
connected to the .gov website. Share sensitive
information only on official, secure websites.
