
Extended Data Figure 6. Peroxisomes and the ether lipid biosynthesis pathway contribute to ferroptosis in liver, endometrial and kidney cancers.
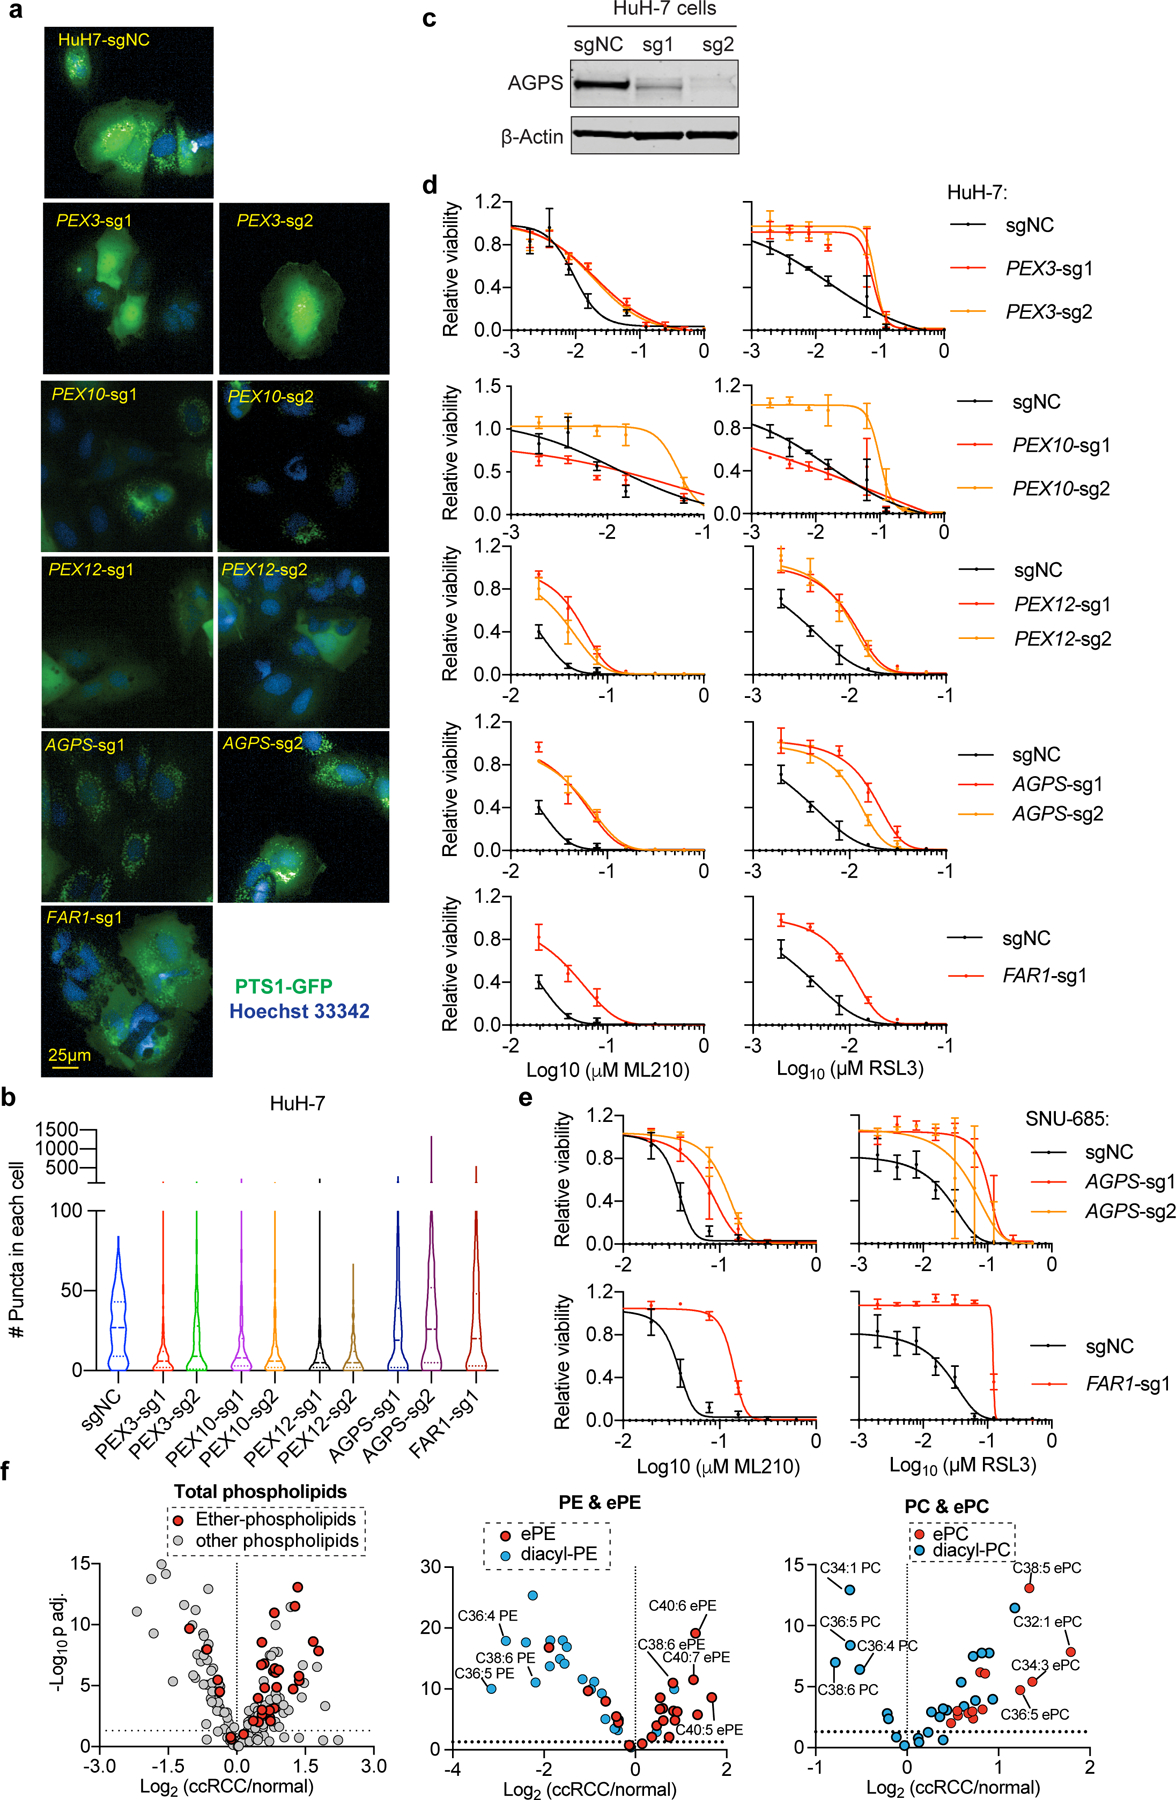
a. Fluorescent imaging analysis of peroxisome abundances, reported by PTS1-emGFP signal, in HuH-7 cells expressing the indicated sgRNAs. Scale bar, 25 µm. Representative images from experiment performed once, and each condition has three biological replicates.
b. Violin plots showing the quantitation of peroxisomes in HuH-7 cells expressing indicated sgRNAs. HuH-7-sgNC, n=250, PEX3-sg1, n=231, PEX3-sg2, n=256, PEX10-sg1, n=600, PEX10-sg2, n=455, PEX12-sg1, n=295, PEX12-sg2, n=278, AGPS-sg1, n=321, AGPS-sg2, n=304, FAR1-sg1, n=411. Lines in violin plots indicate median and quartiles.
c. Immunoblot analysis of AGPS protein levels in HuH-7 cells expressing negative control (sgNC) or AGPS-targeting sgRNAs. β-Actin was used as a loading control. Plot of experiment performed once.
d. Viability curves for HuH-7 cells expressing the indicated sgRNAs treated with indicated concentrations of ML210 or RSL3 for 48 h. n=4 biologically independent samples. Representative results from experiment performed twice.
e. Viability curves for SNU-685 cells expressing the indicated sgRNAs treated with indicated concentrations of ML210 or RSL3 for 48 h. n=4 biologically independent samples. Representative results from experiment performed once.
f. Volcano plots showing the lipidomic analysis (Saito et al. 2016) results comparing 49 pairs of clear-cell renal cell carcinoma (ccRCC) tumor and adjacent normal kidney tissues. n=49 tumor samples, n=49 normal samples. Two-tailed Student’s T-test. Multiple-testing adjustment was performed using the Benjamini-Hochberg method. Abbreviations: PC, phosphatidylcholine; PE, phosphatidylethanolamine; ePE, ether-phosphatidylethanolamine; ePC, ether-phosphatidylcholine.
See Supplementary Information for uncropped immunoblot images. For viability curves, data center and error bars indicate mean±s.d..