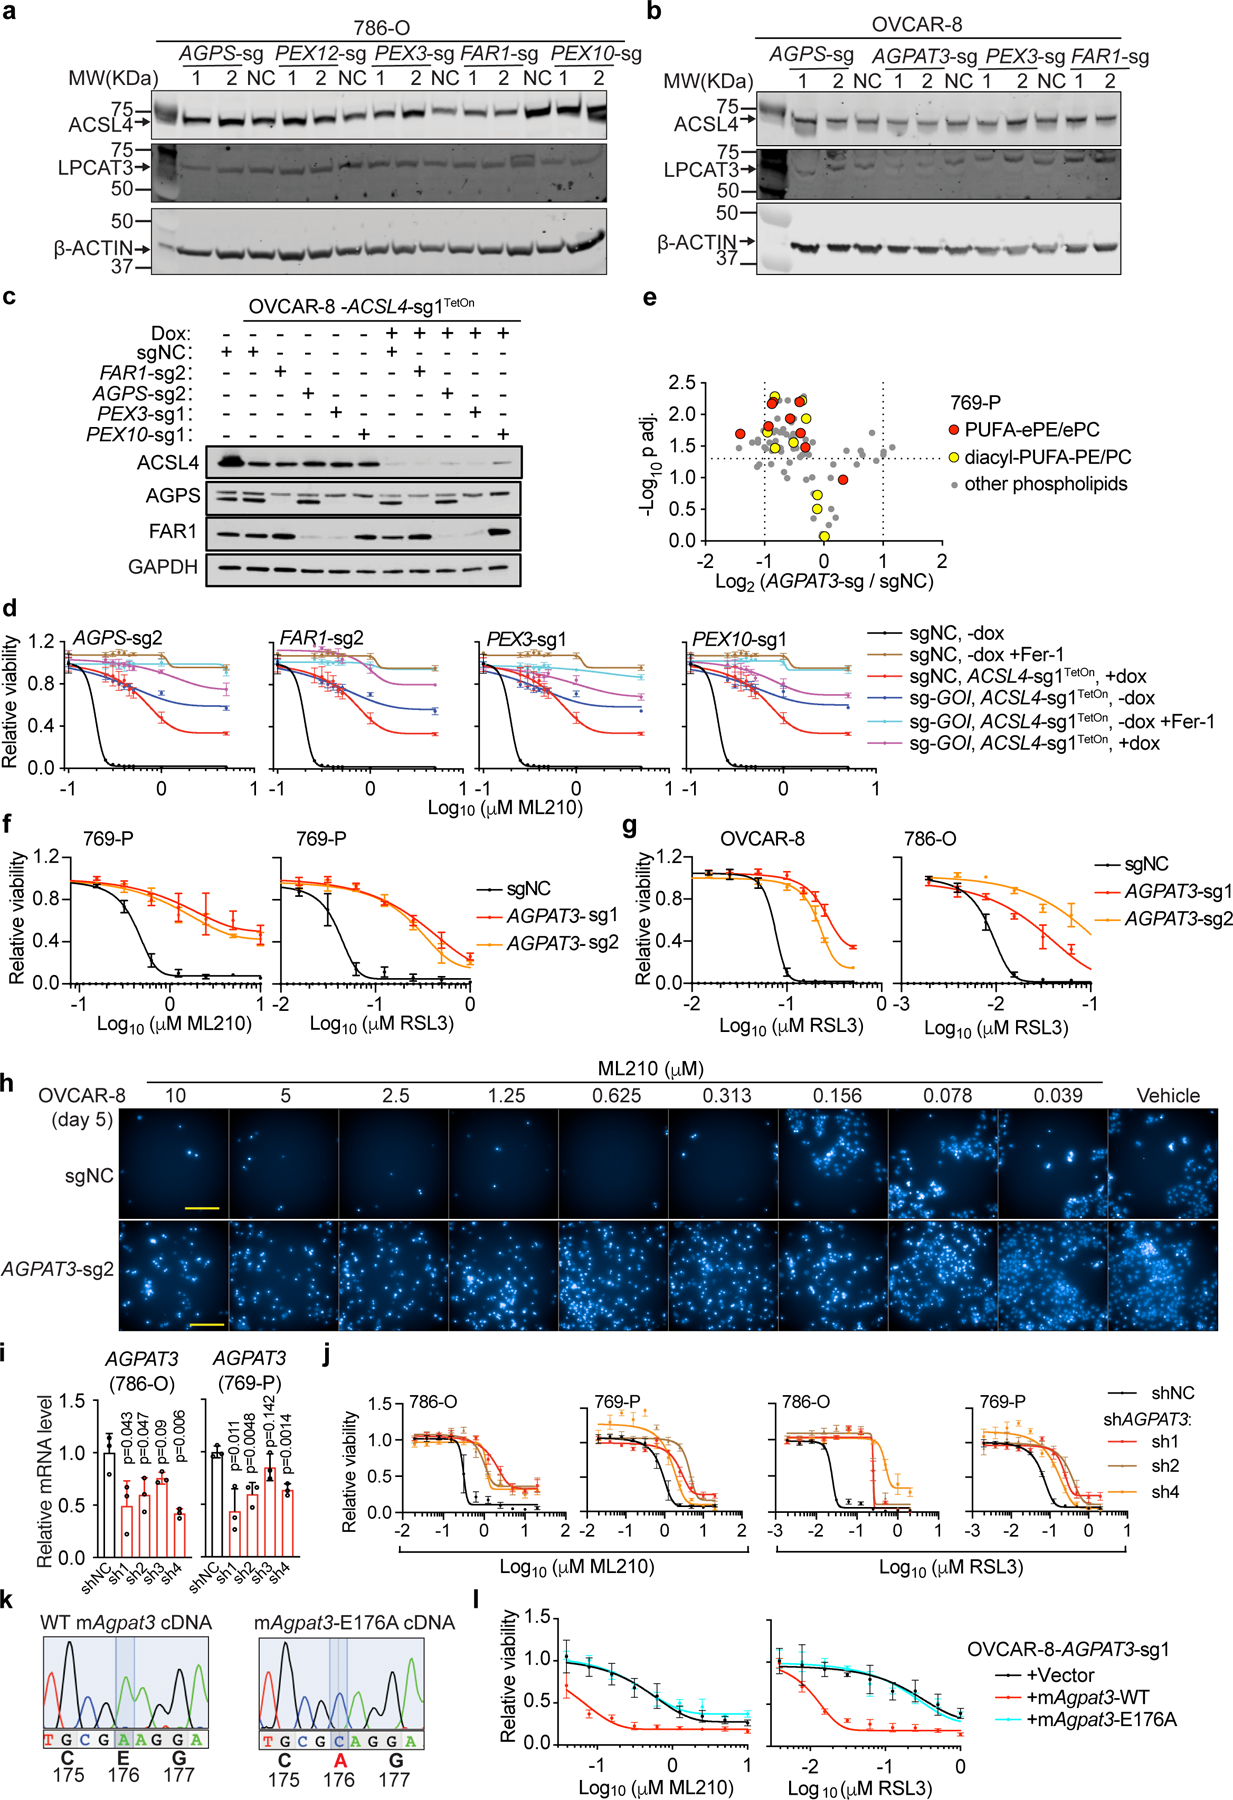
Extended Data Figure 7. AGPAT3 contributes to polyunsaturated ether phospholipid synthesis downstream of peroxisomes.

a. Immunoblot analysis of ACSL4 and LPCAT3 protein levels in 786-O cells expressing the indicated sgRNAs. Plot of experiment performed once.
b. Immunoblot analysis of ACSL4 and LPCAT3 protein levels in OVCAR-8 cells expressing the indicated sgRNAs. Plot of experiment performed once.
c. Immunoblotting of ACSL4, AGPS and FAR1 protein levels in the indicated OVCAR-8 cell lines. Representative result of experiment performed in duplicate.
d. Viability curves of OVCAR-8 cells expressing sgNC or sgRNAs targeting the gene of interest (GOI) as indicated on top of each graph, and transduced with doxycycline (dox)-inducible ACSL4-sgRNA1TetOn construct. These cells were pre-treated with vehicle or dox, and then treated with indicated concentrations of ML210, or ML210+Fer-1 for 72 h. n=3 biologically independent samples. Representative results from experiment performed twice.
e. Volcano plot showing the changes in phospholipid levels in sgNC or AGPAT3-targeting sgRNA expressing 769-P cells. n=3 biologically independent samples. Two tailed Student’s T-test. Multiple-testing adjustment was performed using the Benjamini-Hochberg method.
f. Viability curves for 769-P cells expressing sgNC or AGPAT3-targeting sgRNAs treated with indicated concentrations of ML210 or RSL3 for 48 h. n=4 biologically independent samples. Representative results from experiment performed in triplicate.
g. Viability curves for 786-O and OVCAR-8 cells expressing sgNC or AGPAT3-targeting sgRNAs treated with indicated concentrations of RSL3 for 48 h. n=3 (OVCAR-8) or n=4 (786-O) biologically independent samples. Representative results from experiment performed in triplicate.
h. Fluorescent imaging showing nuclear staining by Hoechst 33342 in OVCAR-8 cells with the indicated genetic perturbations and treated with vehicle (DMSO) or indicated concentrations of ML210 for 5 days. Representative images from experiment performed once, and each condition has three biological replicates.
i. qRT-PCR analysis of relative AGPAT3 mRNA expression in 786-O and 769-P cells expressing non-targeting negative control shRNA (shNC) or AGPAT3-targeting shRNAs. B2M was used as a loading control. n=3 biologically independent samples. Two-tailed student’s T-test; ns, not significant.
j. Viability curves for 786-O, and 769-P cells expressing shNC or AGPAT3-targeting shRNAs treated with indicated concentrations of ML210 or RSL3 for 48 h. n=4 biologically independent samples. Representative results from experiment performed in triplicate.
k. Nucleotide traces in sanger sequencing analysis showing the point mutation introduced in the mouse Agpat3E176A cDNA construct.
l. Viability curves of AGPAT3-sg1-expressing OVCAR-8 cells rescued with sgRNA-resistant, wildtype (WT) mouse Agpat3 or Agpat3E176A mutant cDNA and being treated with indicated concentrations of RSL3 for 24 h. n=4 biologically independent samples. Representative data of experiment performed twice.
β-Actin or GAPDH was used as a loading control. See Supplementary Information for uncropped immunoblot images. For viability curves and bar graphs, data center and error bars indicate mean±s.d..
