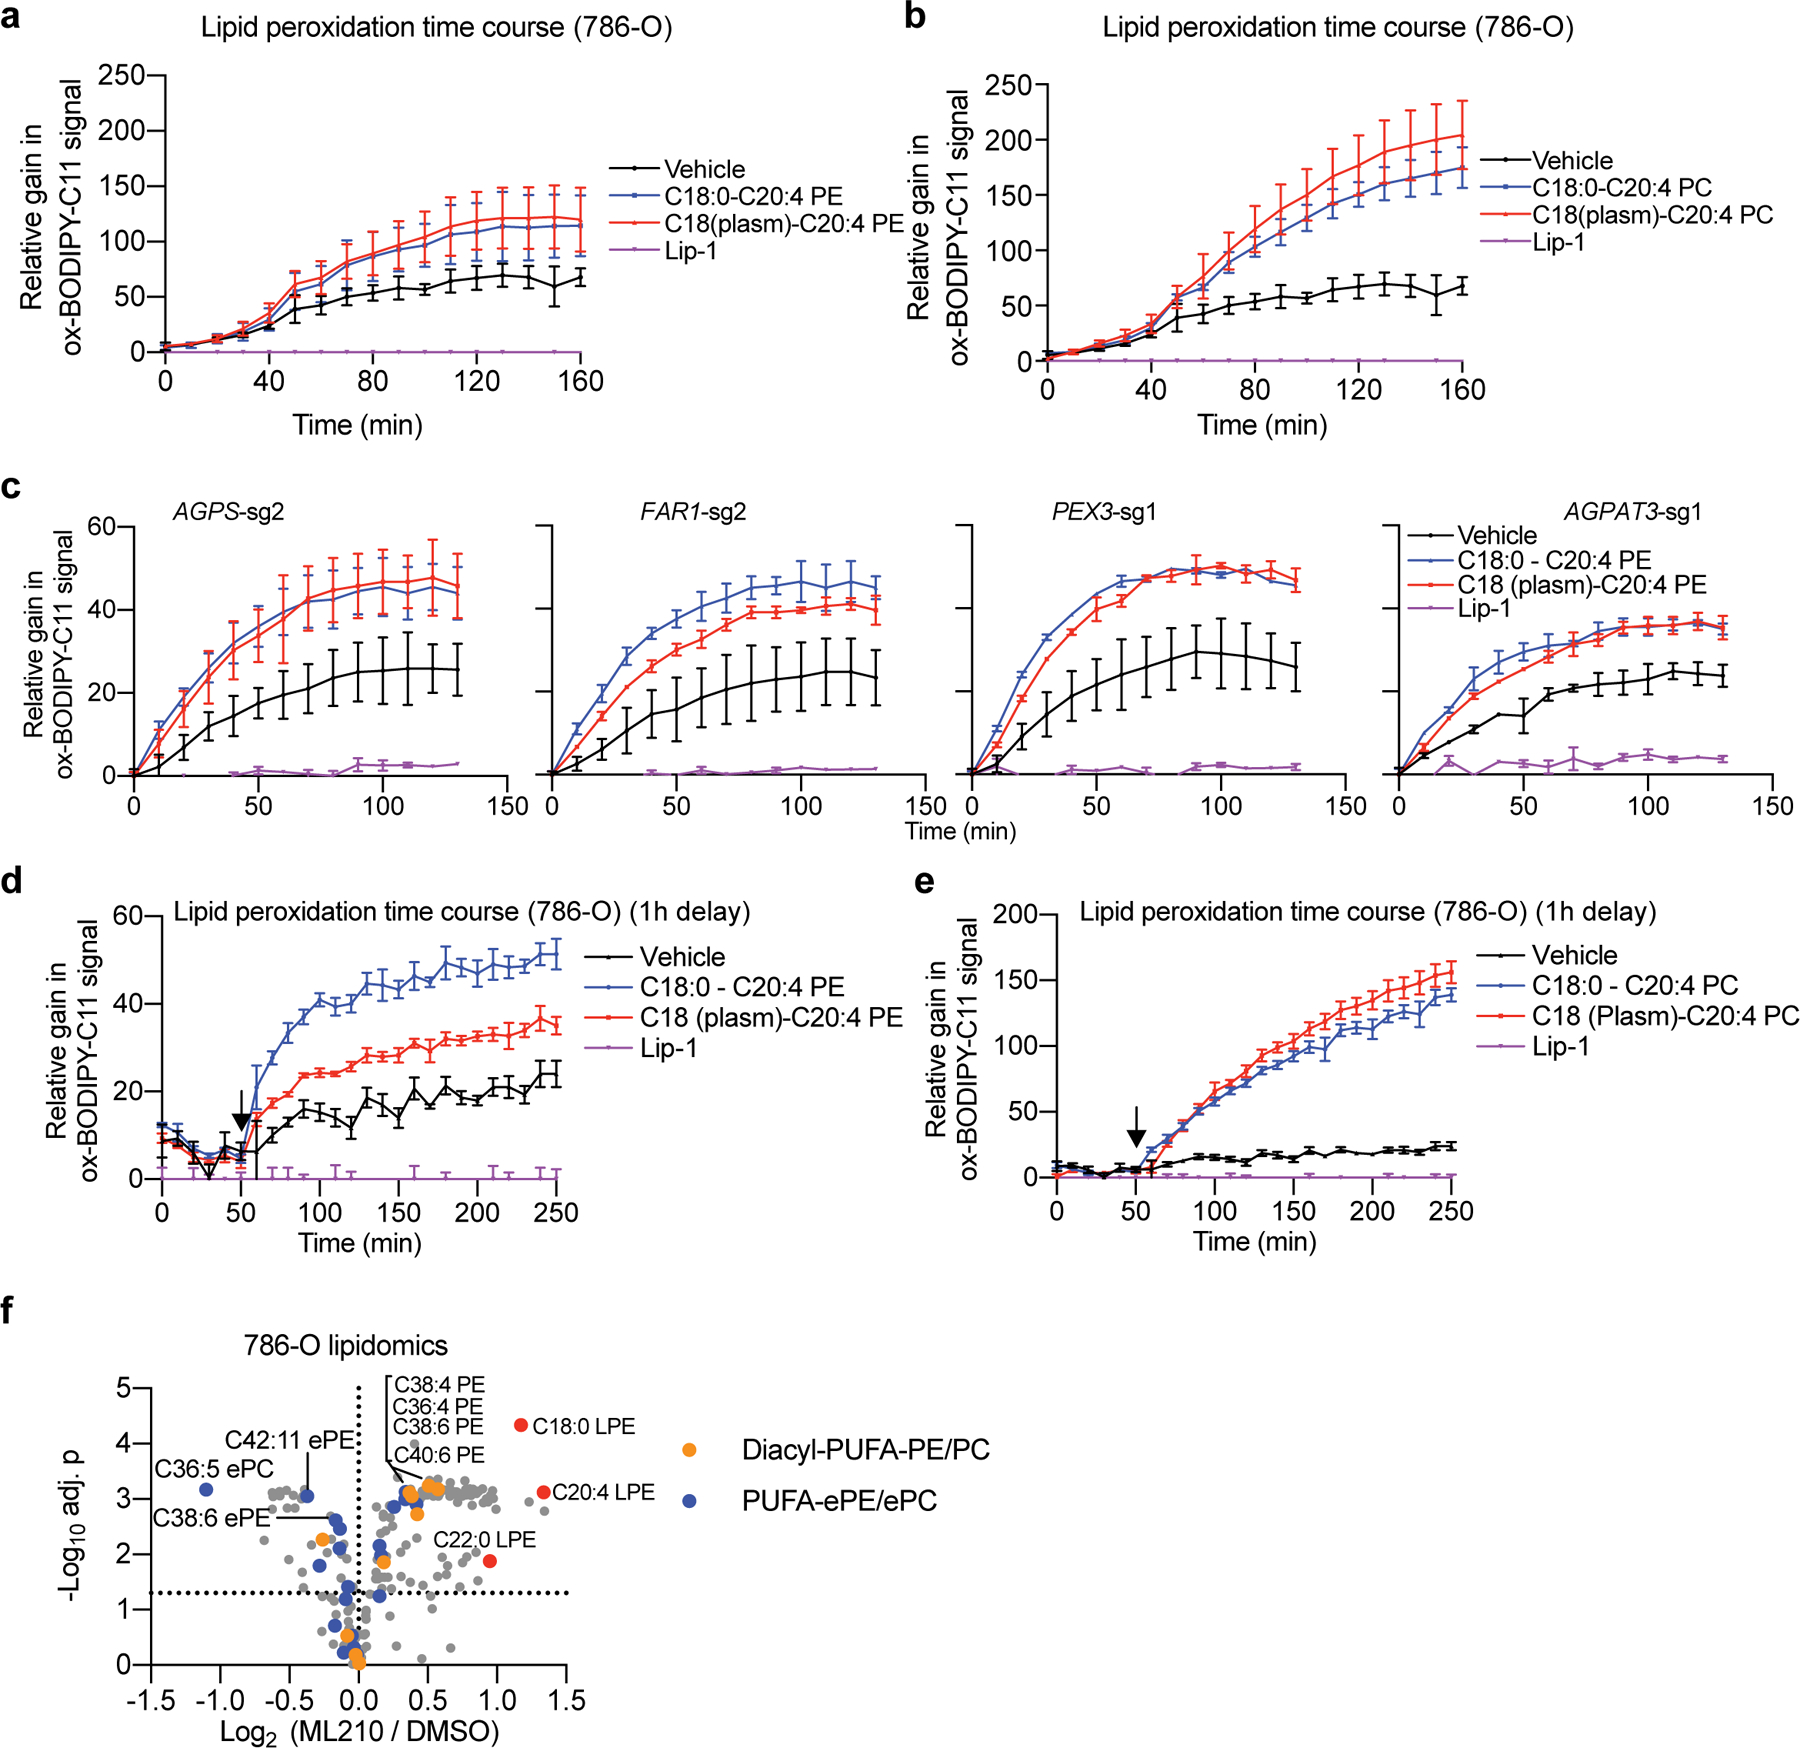
Extended Data Figure 9. Polyunsaturated plasmalogens promote lipid peroxidation in GPX4-inhibited cells.

a. Quantification of time-lapse imaging of lipid peroxidation levels reported by BODIPY-C11 oxidation in 786-O cells co-treated with ML210 and indicated PE nanoparticles or Lip-1. n=3 biologically independent samples.
b. Quantification of time-lapse imaging of lipid peroxidation levels reported by BODIPY-C11 oxidation in 786-O cells co-treated with ML210 and indicated PC nanoparticles or Lip-1. n=3 biologically independent samples.
c. Quantification of time-lapse imaging of lipid peroxidation levels reported by BODIPY-C11 oxidation in 786-O cells expressing the indicated sgRNAs treated with ML210 and indicated PE nanoparticles or Lip-1. n=2 biologically independent samples. Nanoparticles were added at the same time as ML210.
d. Quantification of time-lapse imaging of lipid peroxidation levels reported by BODIPY-C11 oxidation in 786-O cells treated with ML210 and indicated PE nanoparticles or Lip-1. n=3 biologically independent samples. Nanoparticles were added 1 h after ML210 administration (indicated by the arrow, note a 10 min time is deduced for reagent and equipment handling).
e. Quantification of time-lapse imaging of lipid peroxidation levels reported by BODIPY-C11 oxidation in 786-O cells treated with ML210 and indicated PC nanoparticles or Lip1. n=3 biologically independent samples. Nanoparticles were added 1 h after ML210 administration (indicated by the arrow, note a 10 min time is deduced for reagent and equipment handling).
f. Volcano plots showing the lipidomic analysis of 786-O cells treated with ML210 or DMSO for 90 min. n=3 biologically independent samples. Two tailed Student’s T-test. Multiple-testing adjustment was performed using the Benjamini-Hochberg method.
For viability curves and lipid peroxidation time-lapse imaging quantification, data center and error bars indicate mean±s.d..
