
Extended Data Figure 4. AGPS/FAR1-depletion blocks ether phospholipid synthesis and lipid peroxidation.
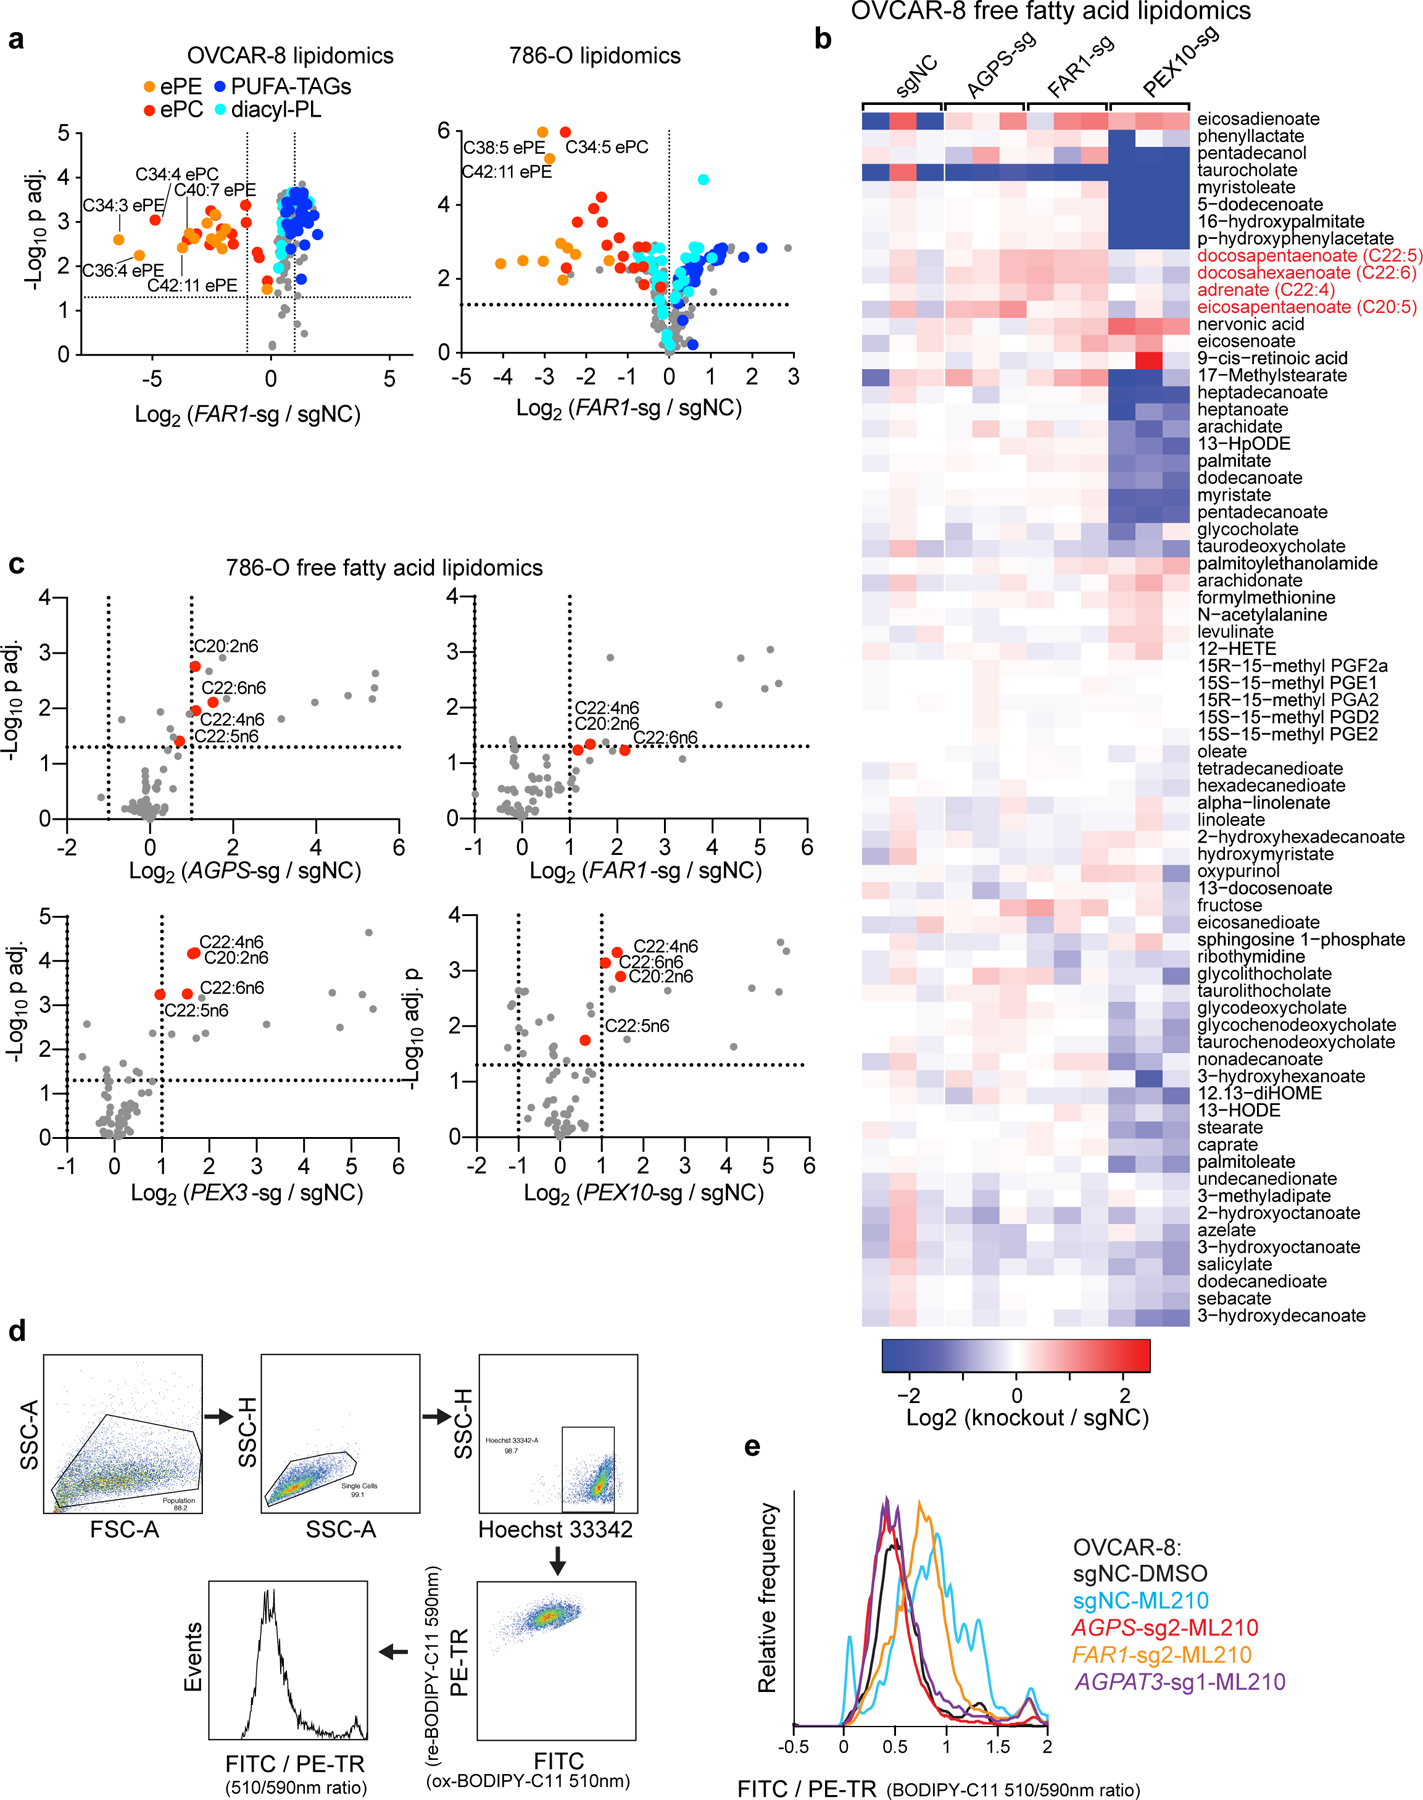
a. Volcano plots showing the lipidomic analysis of OVCAR-8 and 786-O cells expressing sgNC or FAR1-targeting sgRNAs. n=3 biologically independent samples. Two tailed Student’s T-test. Multiple-testing adjustment was performed using the Benjamini-Hochberg method. Abbreviations: ePE, ether-linked phosphatidylethanolamine; ePC, ether-linked phosphatidylcholine; PUFA-, polyunsaturated fatty acyl-; TAG, triacylglycerol; PL, phospholipids.
b. Heatmap showing the relative abundances of free fatty acids in wildtype and AGPS, FAR1, or PEX10-depleted OVCAR-8 cells. n=3 biologically independent samples. Highlighted in red are polyunsaturated fatty acids that are enriched in response to AGPS or FAR1 knockout.
c. Volcano plots showing free fatty acid lipidomic analysis in wildtype and AGPS, FAR1, PEX3 or PEX10-depleted 786-O cells. n=3 biologically independent samples. Highlighted in red are free polyunsaturated fatty acids upregulated in the knockout cells. Two tailed Student’s T-test. Multiple-testing adjustment was performed using the Benjamini-Hochberg method.
d. Representative gating strategy used in the flow cytometry analysis of BODIPY-C11 oxidation levels.
e. Histogram showing the lipid peroxidation levels reported by the ratio between oxidized and reduced BODIPY-C11 levels in the indicated OVCAR-8 cells treated with DMSO or ML210 for 2 h. Plot of experiment performed once.