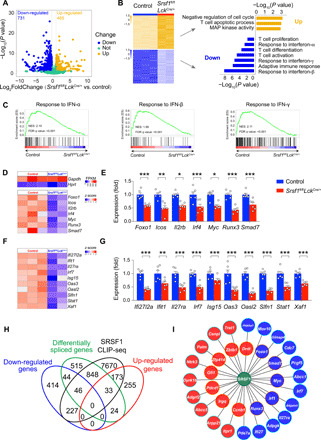
Fig. 6. SRSF1 deficiency altered the expression and splicing of transcripts in TCRβhi DP cells.

(A) Volcano plots show the changes of mRNA abundance in RNA-seq of TCRβhi DP cells. DEGs were identified from Srsf1fl/flLckCre/+ versus control (blue: down-regulated; yellow: up-regulated; green: unchanged). (B) Heatmap of significantly altered genes (left) and representative enriched GO terms (right). MAP, mitogen-activated protein. (C) GSEA was performed for interferon-α (IFN-α), interferon-β (IFN-β), and interferon-γ (IFN-γ) response pathways. NES, normalized enrichment score. (D) Heatmap shows the mRNA abundance of housekeeping genes (Gapdh and Hprt) and key T cell regulators. FPKM, fragments per kilobase million. (E) The expression of key T cell regulators was validated by qPCR in TCRβhi DP cells (n ≥ 5 per group). The relative expression was normalized as described in Fig. 3G. (F) Heatmap shows the mRNA abundance of type I interferon response genes. (G) The expression of type I interferon response genes was validated by qPCR in TCRβhi DP cells (n ≥ 5 per group). The relative expression was normalized as described above. (H) Venn diagram shows the correlation among DEGs, alternatively spliced genes, and SRSF1-binding genes. (I) SRSF1-centered regulatory network. Filled color represents the gene expression relationship with SRSF1 deficiency (red: up-regulation; blue: down-regulation). Border color represents the difference in AS with SRSF1 deficiency [ectopic splicing (blue) or not (orange)]. Solid line indicates the connected genes that were directly bound by SRSF1. Cumulative data are means ± SEM. *P < 0.05, **P < 0.01, and ***P < 0.001 (Student’s t test). Data are from at least three independent experiments.
