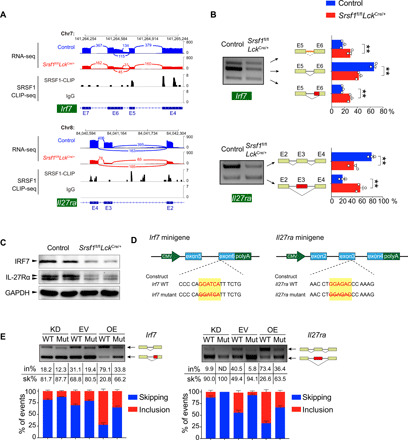
Fig. 7. SRSF1 directly regulates splicing and expression of Irf7 and Il27ra.

(A) Analysis of Irf7 and Il27ra expression and exon-exon junctions. “Sashimi plots” show read coverage and exon-exon junctions (numbers on arches indicate junction reads), and the SRSF1-binding peaks of Irf7 and Il27ra transcripts are shown. IgG, immunoglobulin G. (B) The ectopic splicing of Irf7 and Il27ra in TCRβhi DP cells was analyzed by semiquantitative RT-PCR (n = 3 per group). The scheme and cumulative data on percentage of the indicated fragment are shown accordingly. (C) The protein level of IRF7 and IL-27Rα was determined in DP thymocytes by Western blot. GAPDH, glyceraldehyde-3-phosphate dehydrogenase. (D) Graphical representation of Irf7 and Il27ra minigenes. The potential SRSF1-binding sites are marked in red characters, and the specific deletion mutations are indicated with a strikeout. (E) Analysis of the splicing of Irf7 and Il27ra minigenes by semiquantitative RT-PCR. The constructs with (WT) or without (Mut) SRSF1-binding site were applied for splicing assay under the indicated conditions (KD: SRSF1 knockdown; EV: empty vector; OE: SRSF1 overexpression). The percentages of inclusion (in%; red) and skipping (sk%; blue) within exon 6 of Irf7 or exon 3 of Il27ra transcripts are presented, respectively. Data are means ± SEM. **P < 0.01 (Student’s t test). Data are representative of at least three independent experiments. CMV, cytomegalovirus; ND, not determined.
