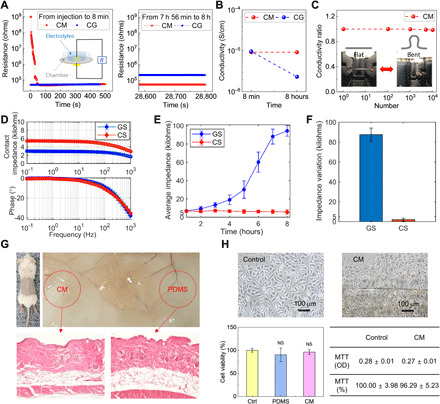
Fig. 2. Electrical characterization and biosafety test of biosensor based on CM.

(A) Comparison of the variations of resistance values of CM and CG for 8 hours. The inset shows the resistance measurement setup. (B) Comparison of variations of ionic conductivity of CM and CG. (C) Electromechanical stability test of CMs. Data show relative variations in conductivity versus bending cycles under repeated bending to an R of 2.5 mm. Inset image shows the flat and bent CMs. (D) Electrochemical impedance spectroscopy test results of CS and GS (E) Comparison of time-dependent average impedance variations of CS and GS measured for 8 hours daily for 7 days. (F) Comparison of impedance variations during an 8-hour continuous recording daily for 7 days. (G) In vivo animal test of CM. The images are of a mouse implanted with a piece of CM and PDMS as a control. Images of hematoxylin and eosin (H&E)–stained tissue around the implant site of CM (left) and PDMS (right) after 14 days. (H) In vitro cytotoxicity test of CM. Data of human keratinocytes cell morphology and MTT assay results. CCK-8 analysis of cell proliferation on culture dish (control), PDMS, and CM during 14 days. Photo credit: Yong Ju Yun, Korea University, and C.-Yoon Kim, Konkuk University.
