
Fig. 5. Pharmacological evaluation of the modality-selective anti-TRPV1 antibody OB1.
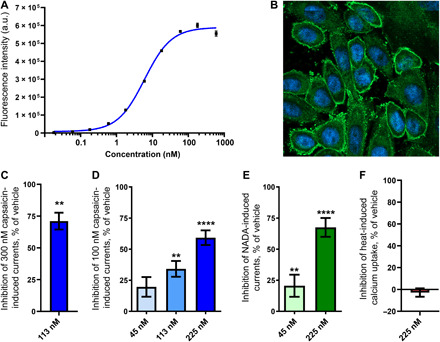
(A) Binding of OB1 to CHO cells overexpressing hTRPV1 measured using flow cytometry (n = 2). a.u., arbitrary unit. (B) Immunocytochemistry image obtained using confocal fluorescence microscopy showing binding of OB1 (green) to overexpressing hTRPV1 CHO cells. Nuclei have been colored blue with Hoechst 33342 (C) Patch-clamp recordings of 300 nM capsaicin-induced TRPV1 currents showing percentage of inhibition after treatment with 113 nM (n = 3) OB1 compared to vehicle (n = 3). Statistical significance was determined using Student’s t test. (D) Patch-clamp recordings of 100 nM capsaicin-induced TRPV1 currents showing percentage of inhibition after treatment with either 225 nM (n = 5), 113 nM (n = 4), or 45 nM (n = 5) OB1 compared to vehicle (n = 13). Statistical significance was determined using a one-way analysis of variance (ANOVA) in combination with Dunnett’s multiple comparison test. (E) Patch-clamp recordings of 1 μM NADA-induced TRPV1 currents showing percentage of inhibition after treatment with either 225 nM (n = 4) or 45 nM (n = 5) OB1 compared to vehicle (n = 13). Statistical significance was determined using a one-way ANOVA in combination with Dunnett’s multiple comparison test. (F) Fluorescence intensity recordings of heat-induced TRPV1-mediated calcium uptake showing percentage of inhibition after treatment with 225 nM (n = 6) OB1 compared to vehicle (n = 13). Statistical significance is indicated as follows: **P < 0.01 and ****P < 0.0001. Data are presented as means ± SEM.