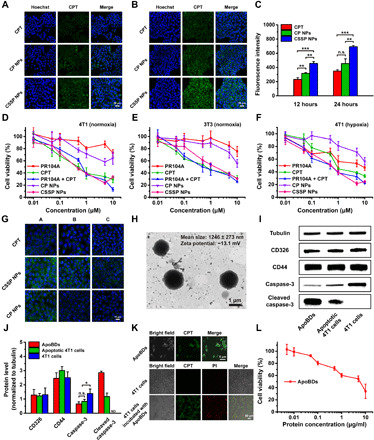
Fig. 3. Cellular uptake, cytotoxicity, and ApoBD-mediated neighboring effect of CSSP NPs.

Fluorescence images of 4T1 cells after incubation with free CPT or prodrug NPs (10 μM, CPT equivalent) for (A) 12 and (B) 24 hours. (C) Flow cytometry of 4T1 cells treated with various formulations (n = 3). n.s., not significant. Cytotoxicity against (D) 4T1 or (E) 3T3 cells under normoxia after 48-hour treatment (n = 6). (F) Cytotoxicity against 4T1 cells under hypoxia after 48-hour treatment (n = 6). (G) Migration of drugs from the infected 4T1 cells to the untreated cells. A, B, and C represented coverslips. (H) Representative TEM image of ApoBDs. (I) Western blot characterization and (J) the semiquantitative analysis by Image-Pro Plus software (n = 3). ND means “not detected.” (K) Confocal laser scanning microscopy (CLSM) images of ApoBDs, 4T1 cells, and 4T1 cells incubated with ApoBDs. Dead cells were labeled with propidium iodide (PI) (red). (L) Cytotoxicity of ApoBDs after 48-hour incubation with 4T1 cells under normoxia (n = 6). Statistical significance: *P < 0.05, **P < 0.01, and ***P < 0.001.
