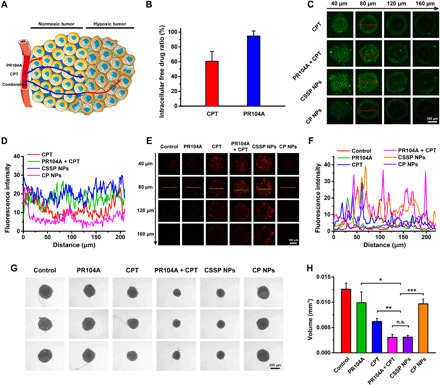
Fig. 4. In vitro enhanced penetration of CSSP NPs in 4T1 tumor spheroids.

(A) Schematic diagram of a combination of CPT and PR104A to overcome the limitations of the neighboring effect for increased drug penetration and tumor-killing ability. Arrows indicate the distance of drug penetration and killing. (B) The proportion of free drugs in total drugs in 4T1 cells under normoxia (n = 3). (C) Z-stack images and (D) quantitative results for drug penetration in three-dimensional (3D) tumor spheroids. (E) CLSM images of dead viability assay and (F) quantitative results after various treatments. Dead cells were labeled with PI (red). (G) Optical images and (H) volume size of 3D tumor spheroids after treated with different formulations (10 μM) for 6 days (n = 3). Statistical significance: *P < 0.05, **P < 0.01, and ***P < 0.001.
