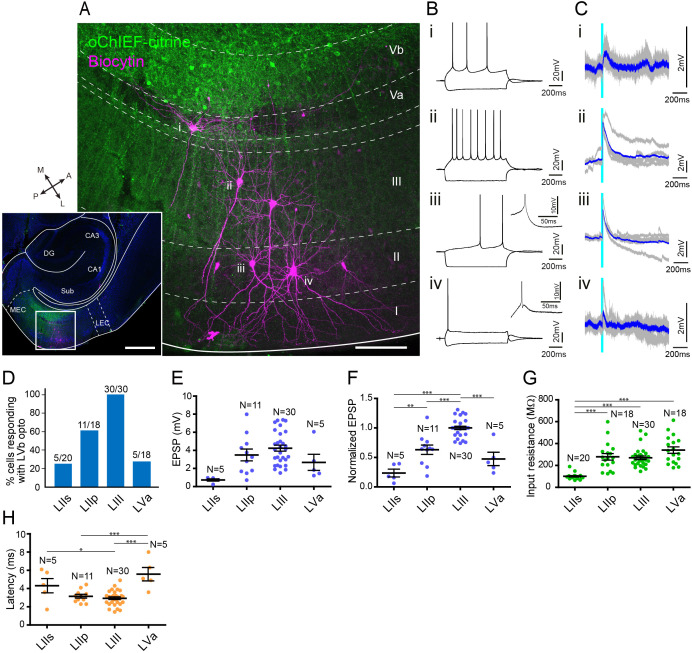
Figure 4. Medial entorhinal cortex-layer Vb (MEC-LVb) neurons preferentially target LII/III pyramidal neurons.
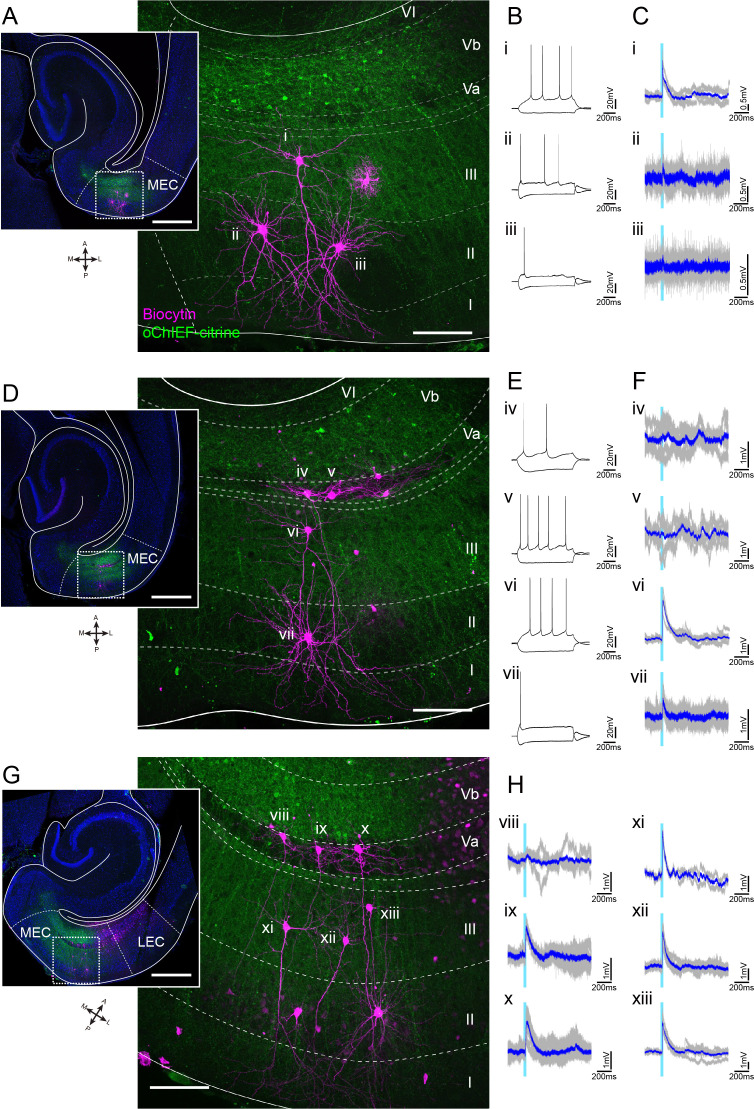
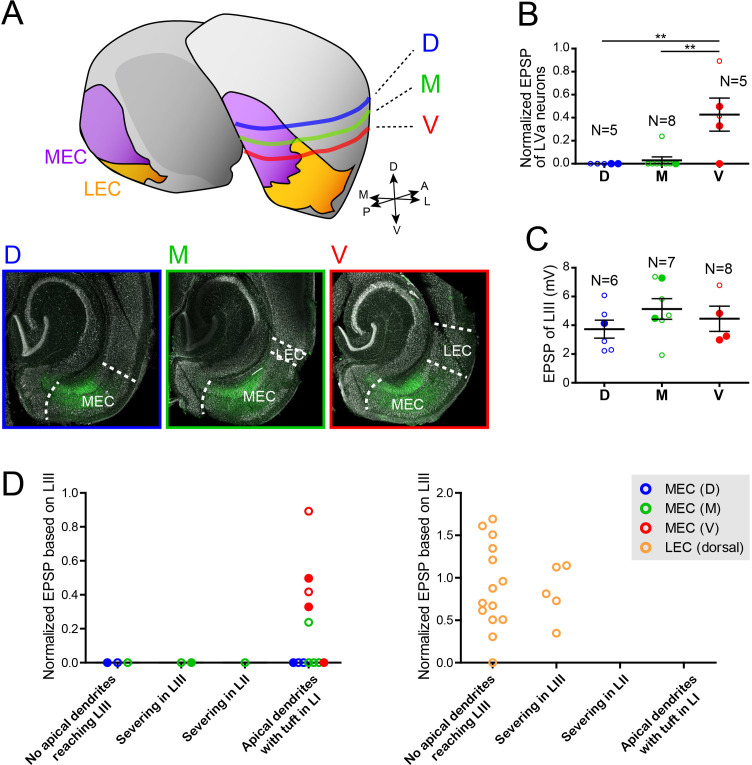
(A) Image of a representative horizontal slice showing expression of oChIEF-citrine in LVb neurons (green) and recorded neurons labeled with biocytin (magenta) in MEC. Inset shows a low-power image of the section indicating the position of the higher power image. Scale bars represent 500 μm (inset) and 100 μm. (B) Voltage responses to injected current steps recorded from neurons shown in (A): i, pyramidal cell in layer Va (LVa); ii, pyramidal cell in LIII; iii, pyramidal cell in LII; iv, stellate cell in LII. Inset in (iii) and (iv) shows the depolarizing afterpotential (DAP) in expanded voltage- and time scale. Note that LII stellate cells (iv) show a clear sag potential and DAP compared to LII pyramidal cells (iii). (C) Voltage responses to light stimulation (light blue line) recorded from neurons shown in (A). Average traces (blue) are superimposed on the individual traces (gray). (D–G) The proportion of responding cells (D), excitatory postsynaptic potential (EPSP) amplitude (E), the normalized EPSP based on LIII response (F, one-way ANOVA, F3,47 = 33.29, ***p<0.0001, Bonferroni’s multiple comparison test, **p<0.01, ***p<0.001), and the input resistance (G, one-way ANOVA, F3,82 = 21.99, ***p<0.0001, Bonferroni’s multiple comparison test, ***p<0.001) was examined for each cell type (error bars: mean ± standard errors). (H) Latency of EPSP onset for MEC neurons to optical activation (F, one-way ANOVA, F3,47 = 11.65, ***p<0.0001, Bonferroni’s multiple comparison test, *p<0.05, ***p<0.001). LIIs: LII stellate cell; LIIp: LII pyramidal cell. Figure 4—source data 1. See also Figure 4—figure supplement 1, Figure 4—figure supplement 2.


