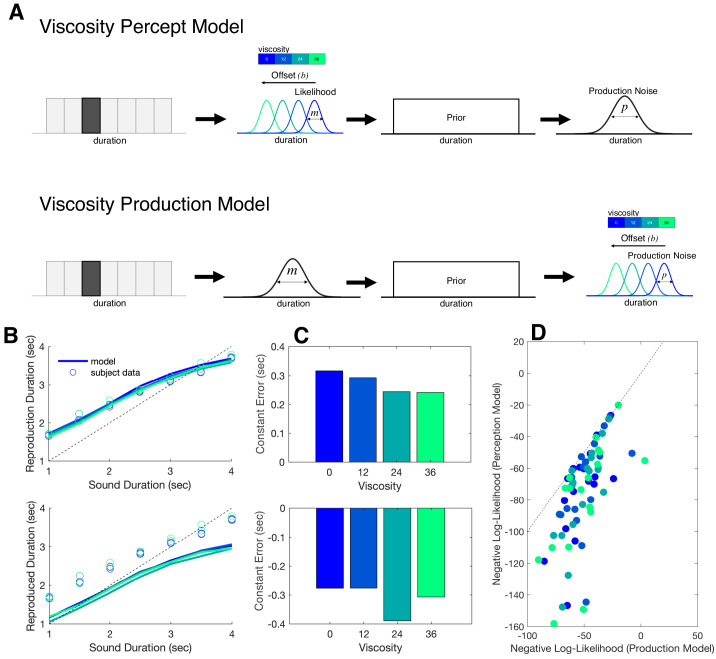
Figure 7. Bayesian observer model of reproduction performance and viscosity.
(A) Schematics for separate Bayesian models, in which the offset term could occur at either measurement level (Perception Model) or the production level (Production Model). (B) Predictive checks for both models, in which model simulations are presented with average subject data for Perception Model (top) and Production Model (bottom). (C) Average Constant Error for Perception (top) and Production (bottom) model simulations. (D) Comparison of Negative Log-Likelihood values for model fits for each model; individual data points represent single subjects, with each color representing a different viscosity. Dashed line represents the identity.

