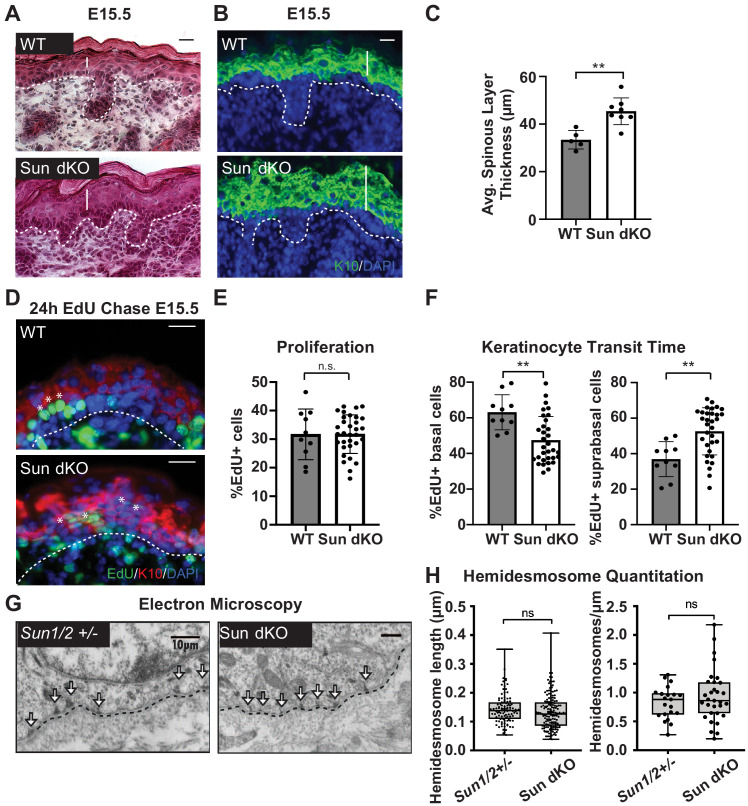
Figure 3. Linker of nucleoskeleton and cytoskeleton complex ablation leads to precocious epidermal differentiation in vivo.
(A) Increased epidermal thickness in Sun dKO mice. Representative hematoxylin and eosin staining of WT and Sun dKO skin at age E15.5. Dotted line denotes dermal/epidermal junction. Vertical line denotes epidermal thickness. Scale bar = 20 μm. (B) Expansion of the spinous layer in Sun dKO mice. Representative immunostaining for keratin 10 (K10) in WT and Sun dKO skin at age E15.5. Dotted line denotes dermal/epidermal junction. Vertical line denotes spinous layer thickness. Scale bar = 20 μM. Nuclei are stained with DAPI. (C) Quantitation of average spinous layer thickness as determined by immunostaining for K10 in WT and Sun dKO epidermis at E15.5. Unpaired t-test was used to determine statistical significance. **p<0.01. Error bars are SD. N = 5–8 biological replicates per genotype. (D–F) Pulse chase analysis reveals an increase in EdU-positive cells in the suprabasal layers of Sun dKO mice (and a decrease in EdU-positive basal cells) but no increase in overall proliferation. (D) Representative images of E15.5 WT and Sun dKO skin 24 hr after EdU pulse. Spinous layer keratinocytes are marked by K10 staining. Dotted line denotes dermal/epidermal junction. Asterisks denote suprabasal keratinocytes marked with EdU. Scale bar = 20 μm. Nuclei are stained with DAPI. (E) Quantitation of total EdU-positive cells normalized to total epidermal cells in both WT and Sun dKO epidermis at E15.5. Statistical significance was determined using unpaired t-test. ns: not significant. N = 3 mice/genotype. (F) Quantitation of location of EdU-positive cells in the epidermis of E15.5 WT and Sun dKO epidermis 24 hr after EdU pulse. K10 staining was used to differentiate suprabasal from basal keratinocytes. Statistical significance was determined by performing unpaired t-test. **p<0.01. N = 3 mice/genotype. (G, H) Adhesion between basal keratinocytes and the basal lamina is normal in the Sun dKO skin. (G) Representative electron microscopy images of P0.5 WT and Sun dKO basal keratinocytes in vivo. Scale bar = 10 μm. Dotted line denotes basement membrane. Arrows point to hemidesmosomes. (H) Quantitation of hemidesmosome length (left) and the number of hemidesmosomes per surface area (right) in control and Sun dKO epidermis at age P0.5. ns: not statistically significant as determined by unpaired t-test.


