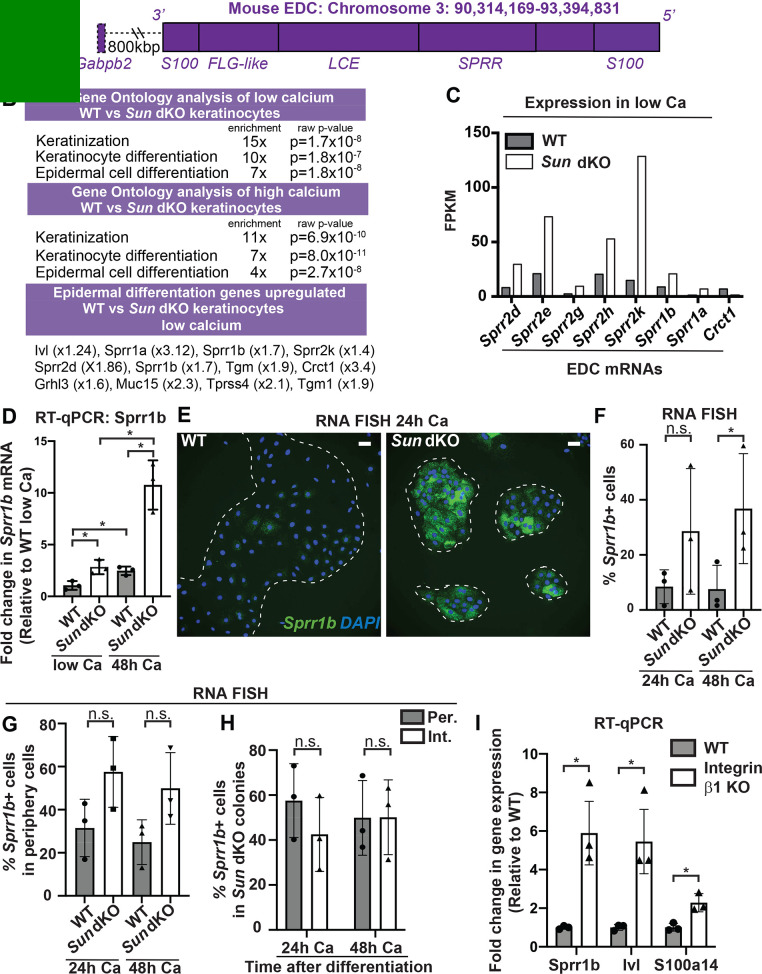
Figure 4. Linker of nucleoskeleton and cytoskeleton complex ablation leads to precocious mouse keratinocyte (MKC) differentiation in vivo, which is associated with aberrant upregulation of differentiation markers at the colony periphery.
(A) Cartoon of the epidermal differentiation complex (EDC), a large genic region that is coordinately upregulated upon epidermal differentiation. (B) Comparative transcriptome analysis reveals that Sun dKO MKCs display precocious expression of epidermal differentiation genes when cultured in low calcium media and higher levels of expression of epidermal differentiation genes in high calcium media. See also Supplementary files 1 and 2. (C) Examples of EDC genes that are precociously expressed in Sun dKO MKCs cultured in low calcium media from the RNAseq data, expressed as fragments per kb of transcript per million reads. (D) Real-time qPCR analysis of Sprr1b in WT and Sun dKO MKCs in the presence and absence of calcium validates precocious Sprr1b expression in Sun dKO MKCs without calcium stimulation. Ct values were normalized to GAPDH. Fold change in expression was determined by calculating the 2ΔΔCt relative to the mean ΔCt of WT MKCs cultured in low calcium media. Statistical significance was determined by performing multiple t-tests. * p<0.05. The Holm–Sidak method was used to correct for multiple comparisons. Error bars are SD. N = 3 biological replicates. (E–G) Cohesive Sun dKO MKCs express elevated levels of differentiation markers and lose the relationship between position in the colony and EDC gene expression. (E) Representative images of RNA fluorescence in situ hybridization (FISH) for Sprr1b in WT and Sun dKO MKCs after 24 hr calcium treatment. Dotted lines are colony outline. Scale bar = 100 μm. (F) Quantitation of RNA FISH for Sprr1b in WT and Sun dKO MKCs after calcium treatment. Sprr1b-positive cells were counted and normalized to total cells in each field. 24h: 24 hr calcium treatment; 48h: 48 hr calcium treatment. Statistical significance was determined by performing unpaired t-test. *p<0.05. ns: not statistically significant. Error bars are SD. N = 3 biological replicates. (G) Quantitation of the percent of Sprr1b-positive cells that are located at the periphery of WT and Sun dKO MKC colonies normalized to the total Sprr1b-positive cells. 24 hr Ca: 24 hr calcium treatment; 48 hr Ca: 48 hr calcium treatment; ns: not statistically significant as determined by unpaired t-test. Error bars are SD. N = 3 biological replicates. (H) Quantitation of the percent of Sprr1b-positive cells that are located at the interior and periphery of Sun dKO MKC colonies normalized to the total Sprr1b-positive cells. 24h: 24 hr calcium treatment; 48h: 48 hr calcium treatment; ns: not statistically significant as determined by unpaired t-test. Error bars are SD. N = 3 biological replicates. (I) Real-time qPCR analysis of Sprr1b, involucrin (Ivl), and S100a14 demonstrate precocious differentiation in β1 integrin null (KO) MKCs. Ct values were normalized to GAPDH. Fold change in expression was determined by calculating the 2ΔΔCt relative to the mean of WT ΔCt. Statistical significance was determined by Student’s t-tests. *p<0.05. Error bars are SD. N = 3 biological replicates.


