Figure 3.

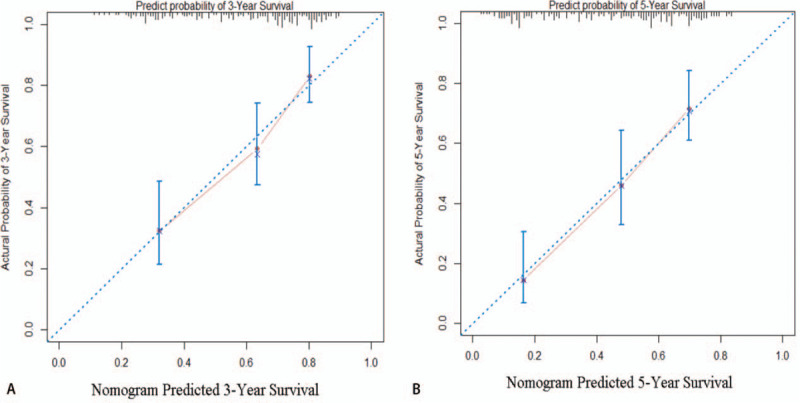
Calibration plot showing nomogram-predicted 3-year OS probabilities with the actual 3-year OS (A) and the nomogram-predicted 5-year OS with the actual 5-year OS (B). OS = overall survival.

Calibration plot showing nomogram-predicted 3-year OS probabilities with the actual 3-year OS (A) and the nomogram-predicted 5-year OS with the actual 5-year OS (B). OS = overall survival.