
Figure 3.
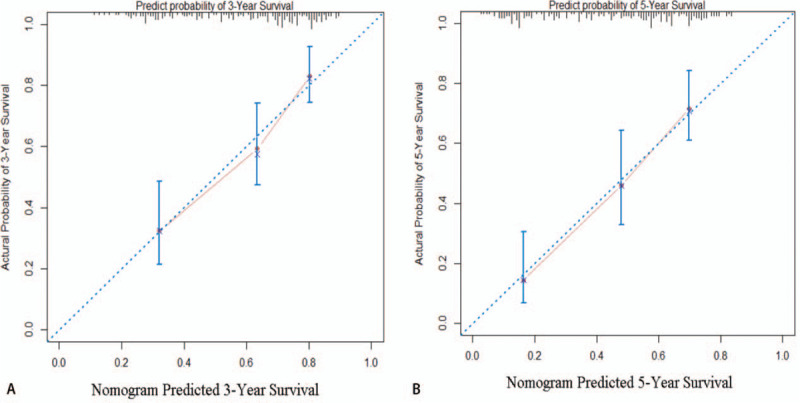
Calibration plot showing nomogram-predicted 3-year OS probabilities with the actual 3-year OS (A) and the nomogram-predicted 5-year OS with the actual 5-year OS (B). OS = overall survival.
Official websites use .gov
A
.gov website belongs to an official
government organization in the United States.
Secure .gov websites use HTTPS
A lock (
) or https:// means you've safely
connected to the .gov website. Share sensitive
information only on official, secure websites.
Calibration plot showing nomogram-predicted 3-year OS probabilities with the actual 3-year OS (A) and the nomogram-predicted 5-year OS with the actual 5-year OS (B). OS = overall survival.