
Fig. 1.
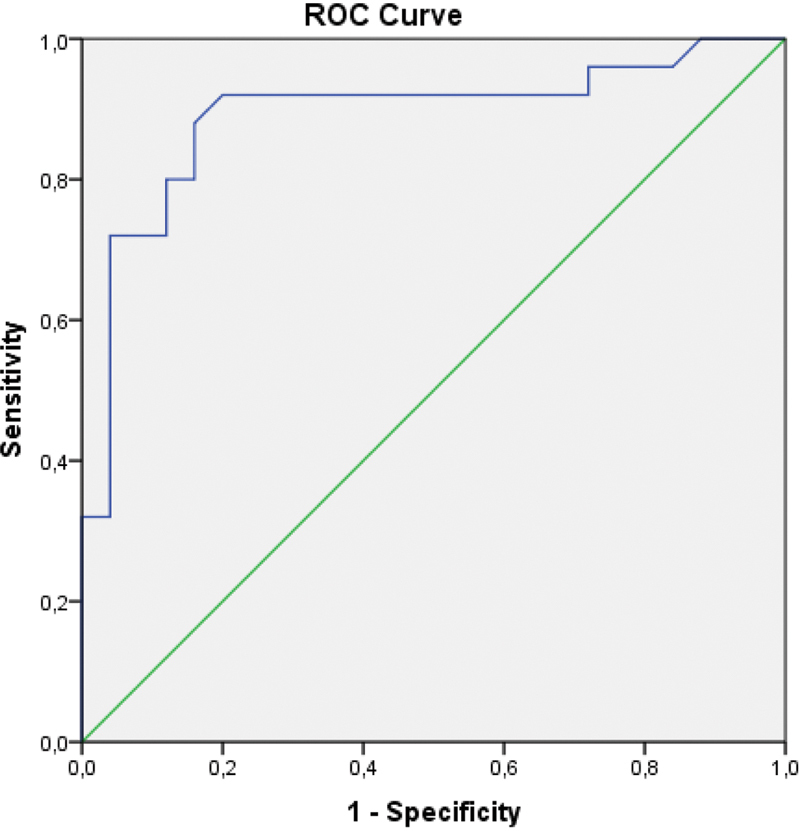
Area under the curve-receiver operating curve analysis of neutrophil to lymphocyte ratio. Diagonal segments are produced by ties.
Official websites use .gov
A
.gov website belongs to an official
government organization in the United States.
Secure .gov websites use HTTPS
A lock (
) or https:// means you've safely
connected to the .gov website. Share sensitive
information only on official, secure websites.
Area under the curve-receiver operating curve analysis of neutrophil to lymphocyte ratio. Diagonal segments are produced by ties.