
Figure 5.
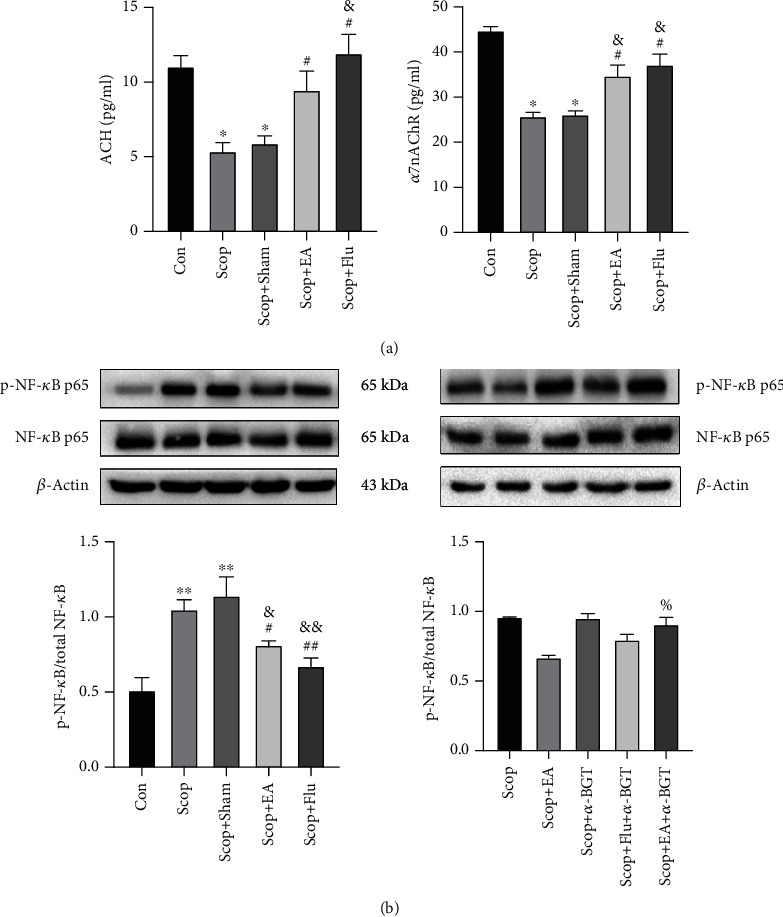
Effect of electroacupuncture on the changes in ACH and α7nAChR in the LG determined using ELISA. (a) Western blot of the effect of EA on the activation of NF-κB with β-actin as a load control. (b) Quantitative data are expressed as mean ± SEM (n = 3). ∗P < 0.05 and ∗∗P < 0.01 vs. the Con group; #P < 0.05 and ##P < 0.01 vs. the Scop group; &P < 0.05 and &&P < 0.01 vs. the Scop+Sham group; %P < 0.05 vs. the Scop+EA group.