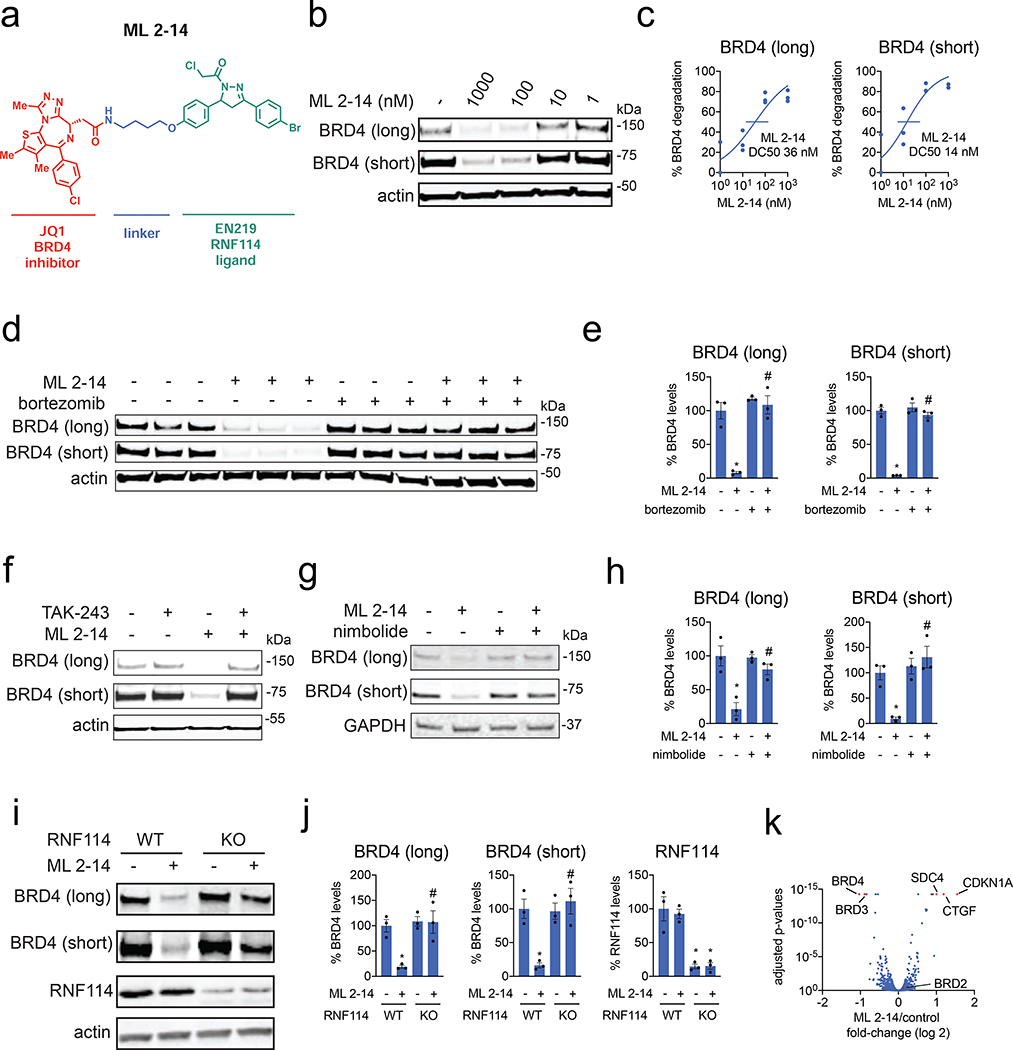
Figure 3. EN219-based BRD4 degrader.
(a) Structure of ML 2–14, an EN219-based BRD4 degrader linking EN219 to BET inhibitor JQ1. (b) Degradation of BRD4 by ML 2–14. 231MFP cells were treated with DMSO vehicle or ML 2–14 for 8 h and the long and short isoforms of BRD4 and loading control actin were detected by Western blotting. (c) Percentage of BRD4 degradation quantified from (b) show 50 % degradation concentrations of 36 and 14 nM for the long and short isoforms of BRD4, respectively. (d) Proteasome-dependent degradation of BRD4 by ML 2–14. 231MFP cells were treated with DMSO vehicle or with proteasome inhibitor bortezomib (1 μM) 30 min prior to DMSO vehicle or ML 2–14 (100 nM) treatment for 8 h. BRD4 and loading control actin levels were detected by Western blotting. (e) Quantification of BRD4 levels from (d). (f) Ubiquitin activating enzyme (E1)-dependent degradation of BRD4 by ML 2–14. 231MFP cells were treated with DMSO vehicle or with E1 inhibitor TAK-243 (10 μM) 30 min prior to DMSO vehicle or ML 2–14 (100 nM) treatment for 8 h. BRD4 and loading control actin levels were detected by Western blotting. Quantification of blot can be found in Figure S4b. (g) BRD4 degradation by ML 2–14 is attenuated by nimbolide. 231MFP cells were treated with DMSO vehicle or with nimbolide (4 μM) 30 min prior to DMSO vehicle or ML 2–14 (100 nM) treatment for 8 h. (h) Quantification of BRD4 levels from (g). (i) Degradation of BRD4 in RNF114 wild-type (WT) or knockout (KO) HAP1 cells. RNF114 WT or KO HAP1 cells were treated with DMSO vehicle or ML 2–14 (1 μM) for 16 h and BRD4, RNF114, and loading control actin levels were detected by Western blotting. (j) Quantification of data from (i). (k) TMT-based quantitative proteomic data showing ML 2–14-mediated protein level changes in 231MFP cells. 231MFP cells were treated with DMSO vehicle or ML 2–14 for 8 h. Shown are average TMT ratios for all tryptic peptides identified with at least 2 unique peptides. Shown in red are proteins that showed >2-fold increased or decreased levels with ML 2–14 treatment with adjusted p-values <0.05. Data in (b-k) are from n=3 biologically independent replicates/group. Data shown in (c) are average and individual replicate values. Data shown in (e, h, j) are averages ± sem values and also individual biological replicate values. Blots shown in (b, d, f, g, i) are representative of n=3 biologically independent replicates/group. Statistical significance was calculated with unpaired two-tailed Student’s t-test and is expressed as *p<0.05 compared to vehicle-treated controls in (e, h, j) and #p<0.05 compared to ML 2–14-treated groups in (e, h) and compared to ML 2–14-treated RNF114 WT cells in (j). This figure is related to Figures S3–S4.

