
Figure 2: NMR characterization of titin N2A.
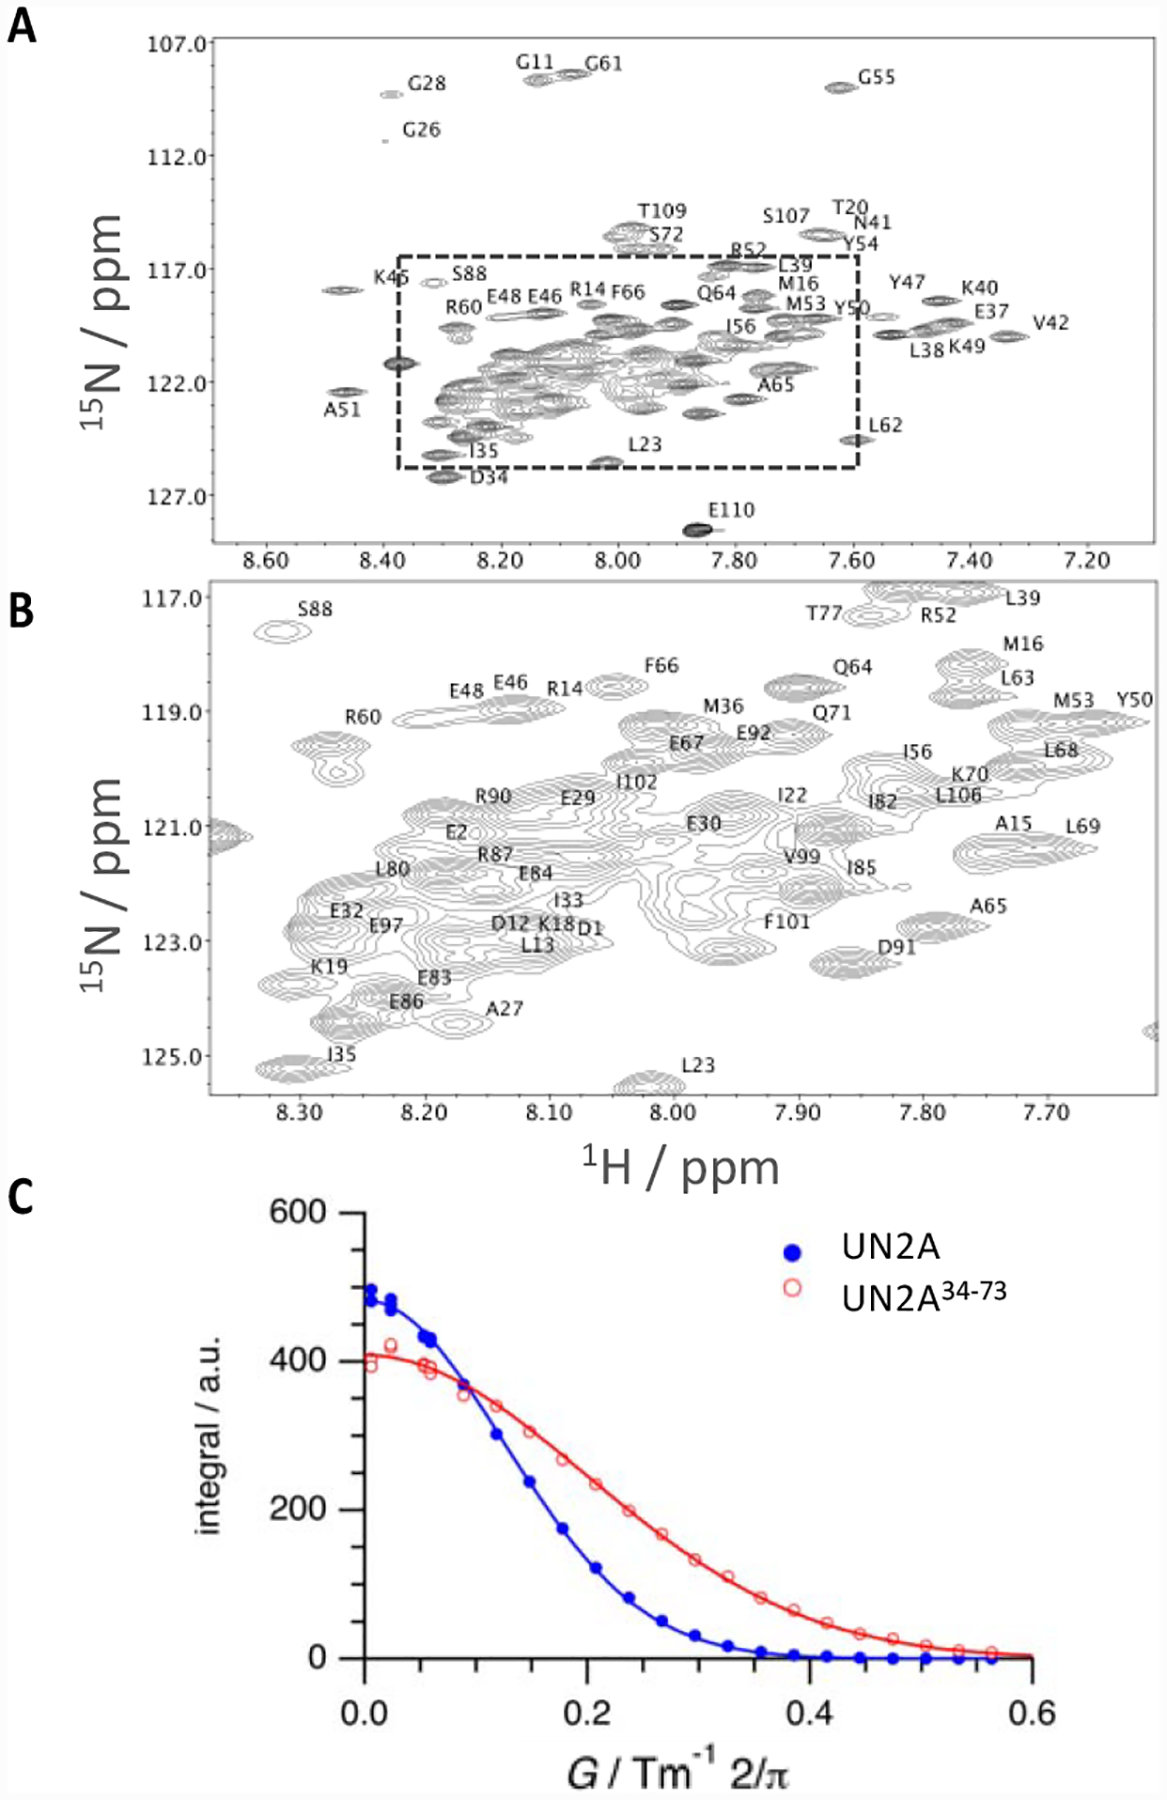
A., B. 1H-15N TROSY-HSQC NMR spectrum of UN2A. Assigned peaks are labelled. Entire spectral range (A) and (B) zoom into the region selected in A (box) are shown; C. Diffusion profiles acquired for UN2A (closed circles, blue) and its central segment, UN2A34−73 (open circles, red) and data fitting by applying Stejskal-Tanner equation (straight lines).