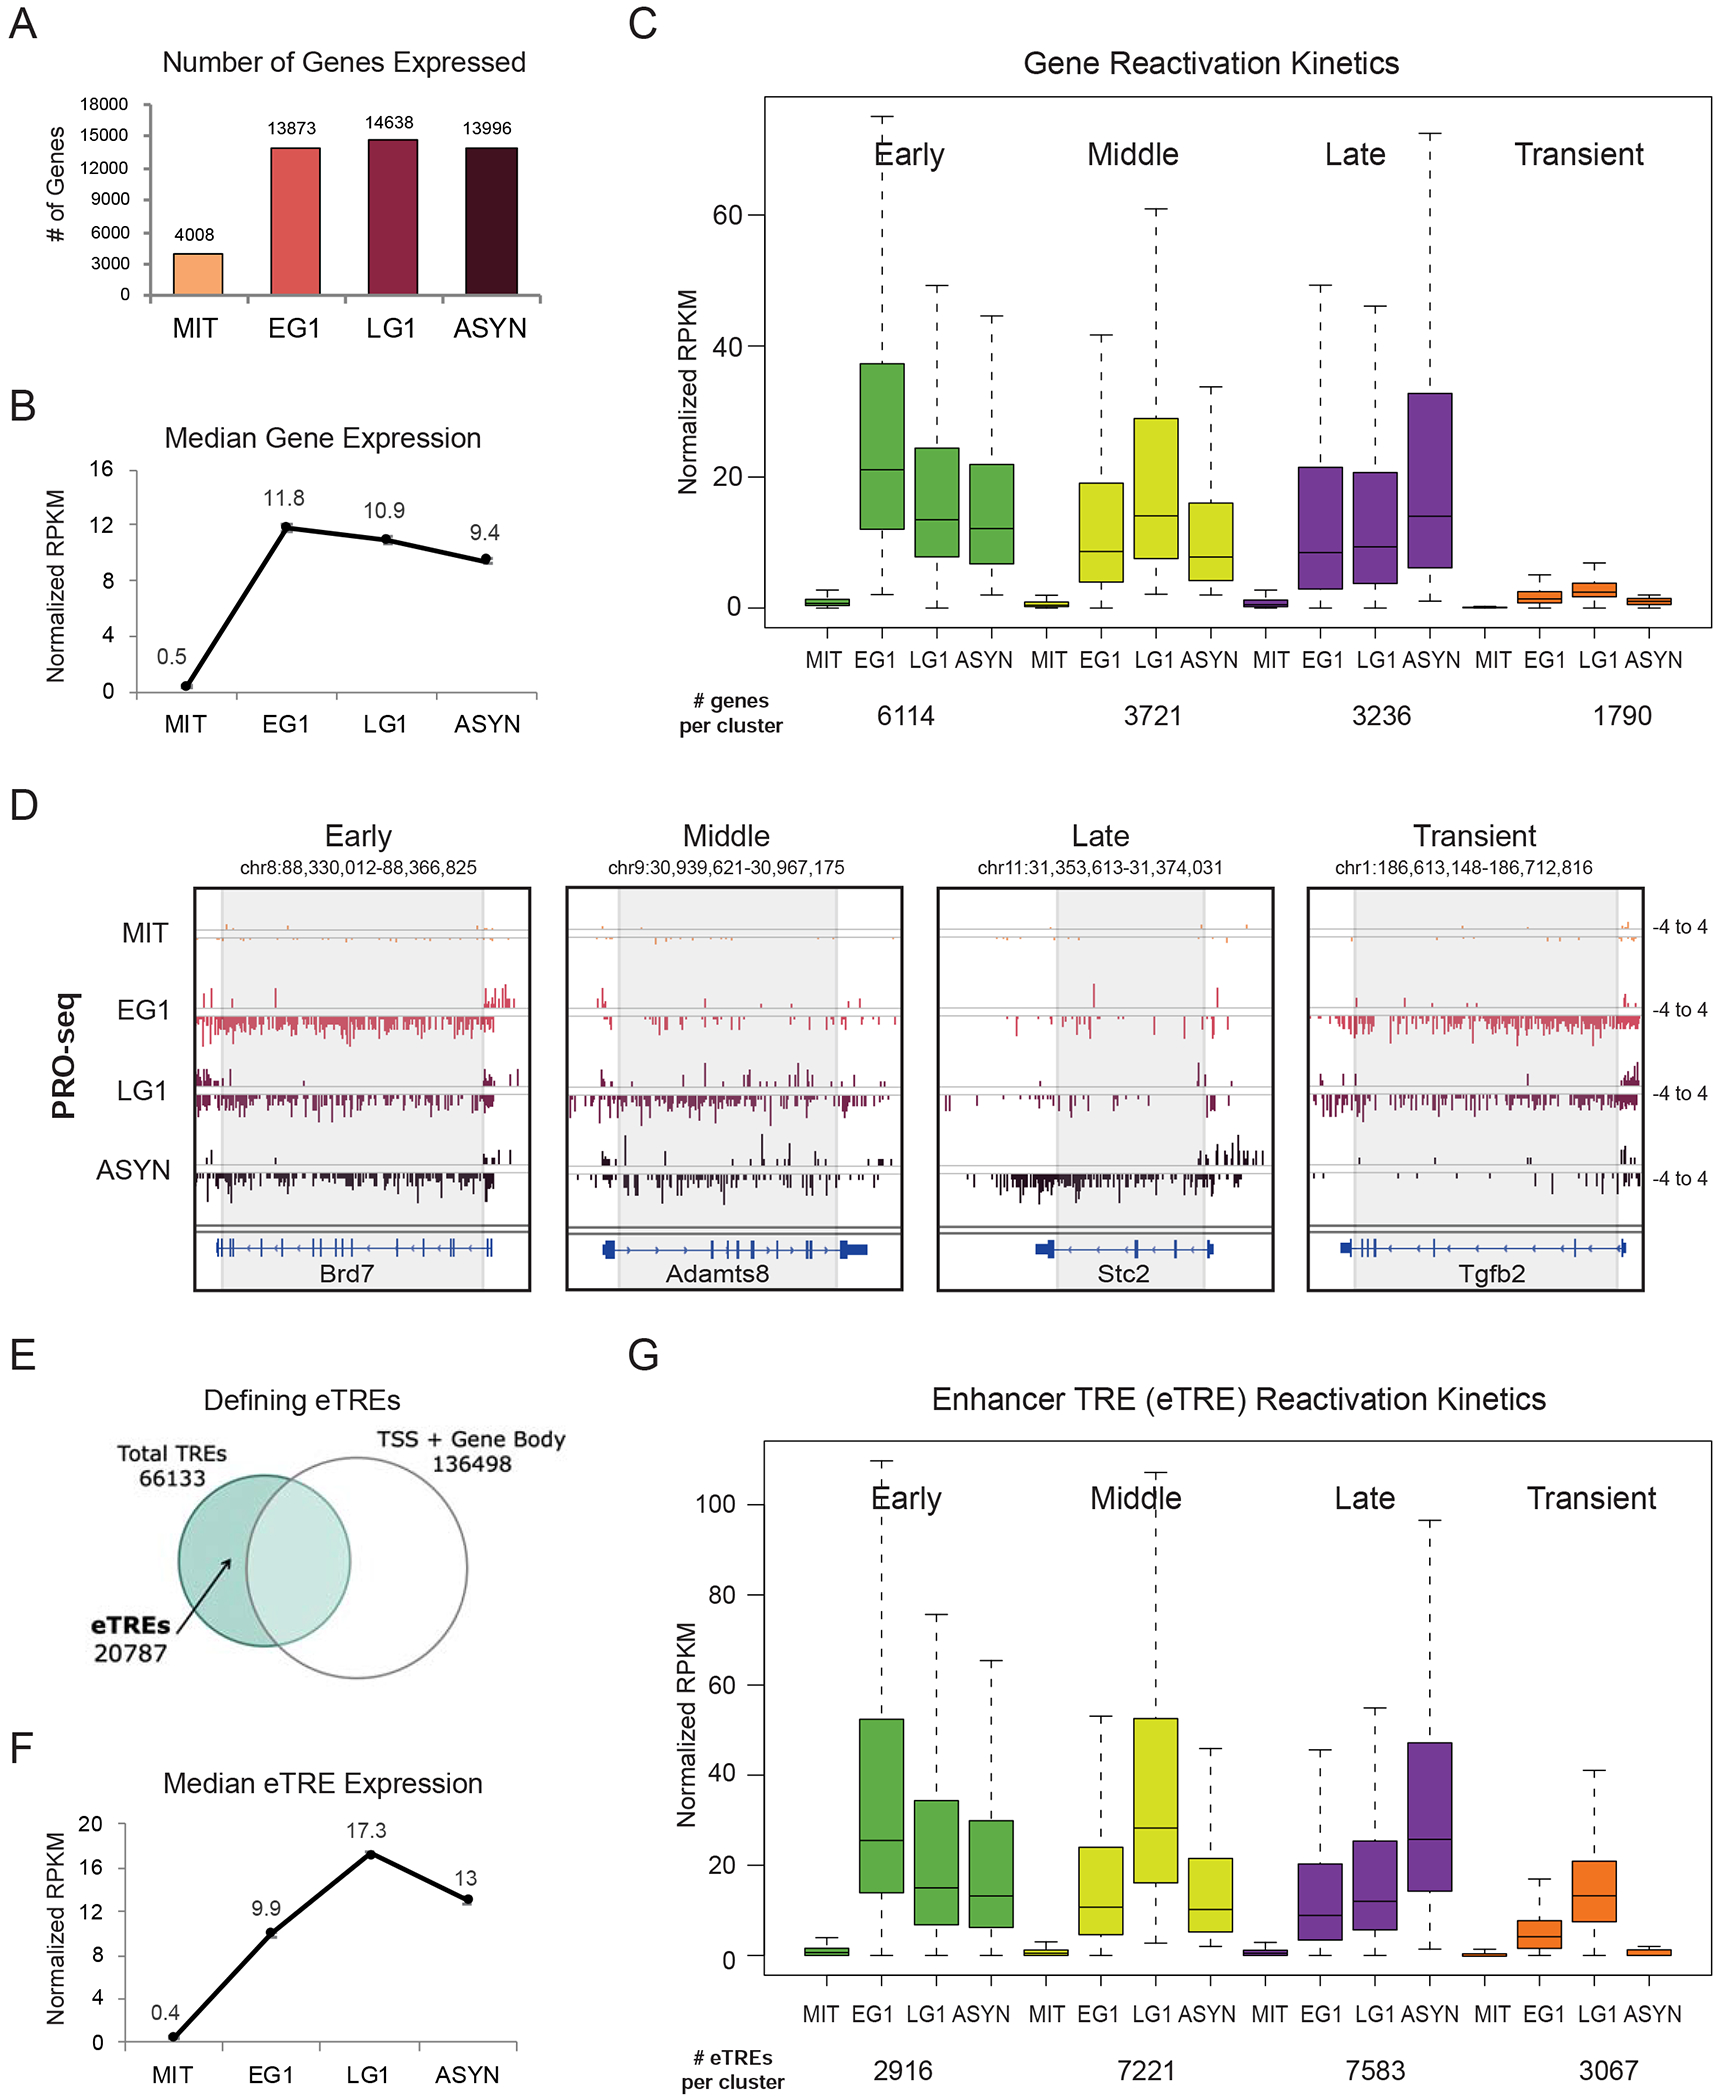
Figure 2.

Distinct waves of gene and enhancer reactivation during mitotic exit (A) Number of genes expressed at each time point (RPKM>1 after normalization to Drosophila spike-in control and number of cells). (B) Median expression at each time point of all expressed genes. Error bars show +/− SEM of two biological replicates. (C) Genes were assigned to a group based on when they reached their maximal expression level (EG1 = early, LG1 = middle, ASYN = late). Transient genes were defined as normalized RPKM <2 in ASYN but >2 in EG1 and/or LG1. Box plots depict the median transcriptional activity across the time course; number of genes per cluster listed below. (D) Genome browser tracks of PRO-seq data (plus and minus strands) for one gene from each reactivation group. Grey box approximates the region used to quantify genic PRO-seq signal. (E) Strategy for identifying enhancer transcriptional regulatory elements (eTREs) using PRO-seq and published TSS data. Total TREs were defined using dREG. (F) Median expression at each time point of all 20787 identified eTREs. Error bars show +/−SEM of two biological replicates. (G) Patterns of eTRE transcriptional reactivation kinetics, defined as in (C). Box plots depict the median transcriptional activity across the time course. See also Figures S1, S2 and Tables S1, S6
