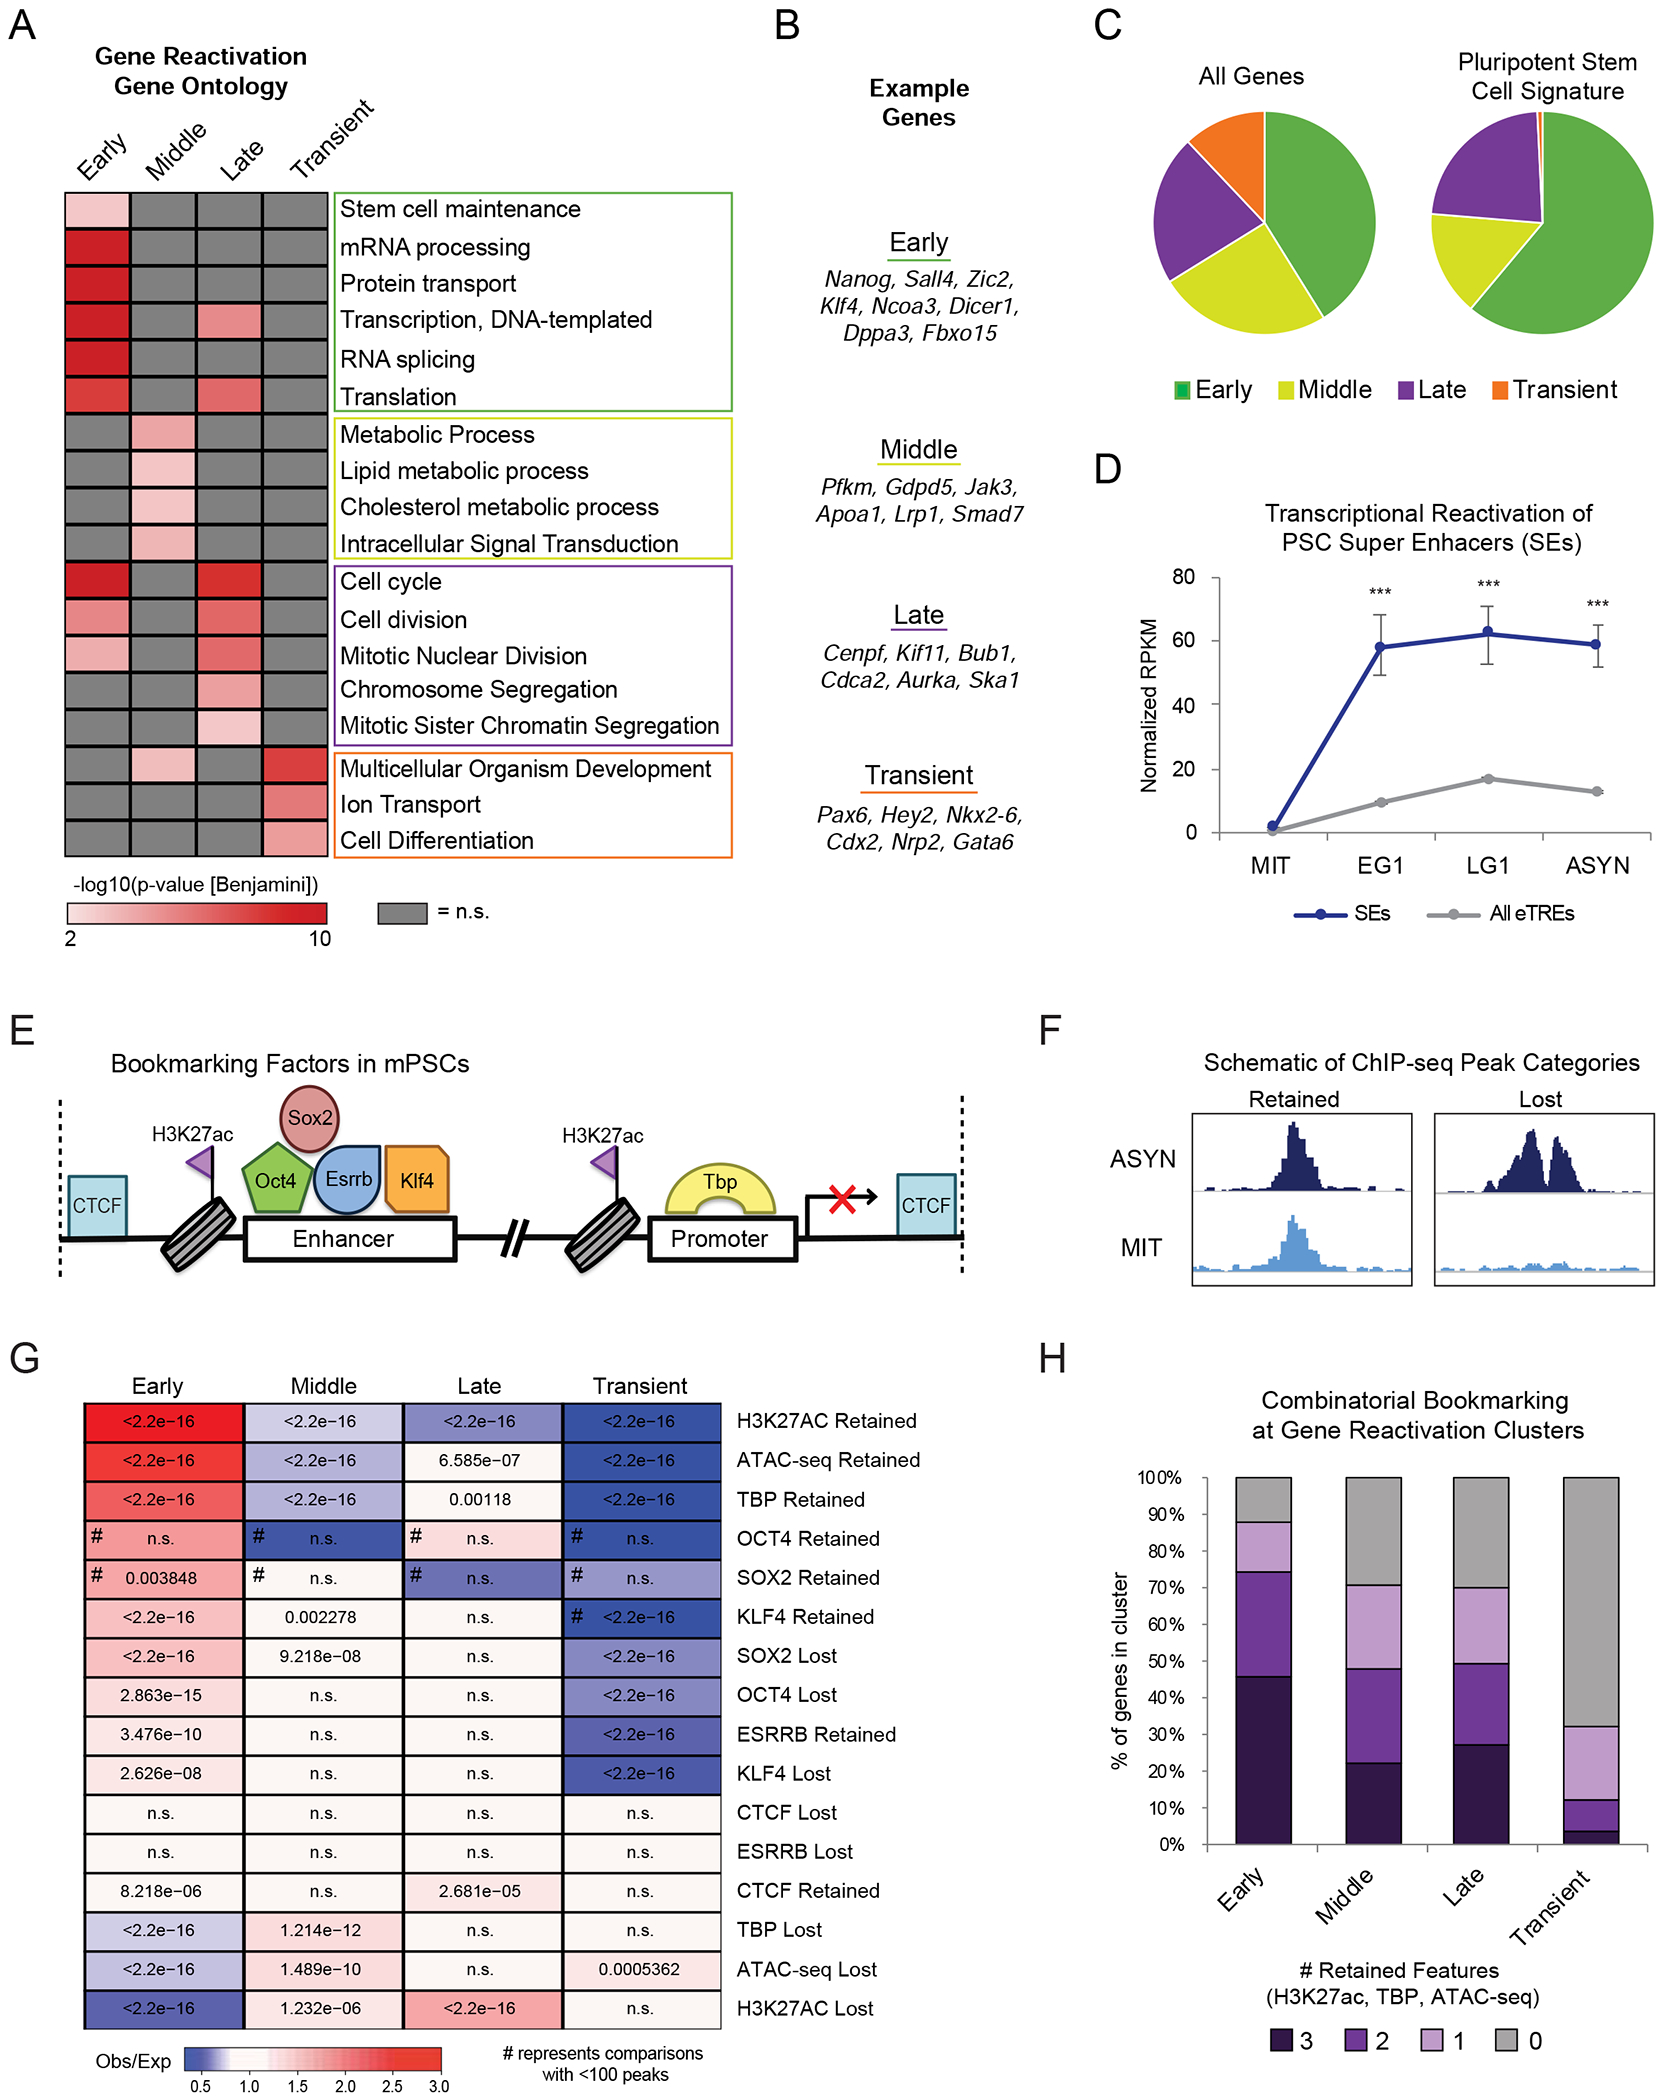
Figure 3.

Bookmarked, stem cell genes and enhancers are rapidly reactivated upon mitotic exit (A) Heat map indicates the enrichment (-log10(pvalue)) of selected top Gene Ontology (GO) terms in each gene reactivation cluster. Adjusted (Benjamini) p-value <0.01was used as cut-off. Not significant terms are shown in grey. (B) Example genes in each reactivation group corresponding to top GO terms. (C) Pie charts show the distribution of all 14861 expressed genes (“All Genes”) versus 478 genes defined in an ESC/iPSC signature (Papadimitriou et al., 2016) (“Pluripotent Stem Cell Signature”) within the reactivation clusters. (D) Transcriptional reactivation of eTREs that overlap with defined PSC SEs (n=255 eTREs) (Whyte et al., 2013) compared to all other eTREs (n=20532 eTREs). Error bars show upper and lower limit of the 95% confidence interval. Asterisks indicate significance (*** p<0.0001) for SEs vs. Other eTREs, two-sided Wilcoxon’s rank sum test. (E) Schematic depicting the various proteins and histone modifications that have been identified as putative mitotic bookmarks in PSCs and have available ChIP-seq both in mitotic and asynchronous cells. (F) Schematic showing how we categorized published ChIP-seq peaks as Retained or Lost during mitosis. (G) Relative enrichment or depletion of the Retained/Lost peaks for each bookmarking factor at the promoters (+/−2.5kb from TSS) of each gene reactivation cluster. Color indicates ratio of observed (Obs) versus expected (Exp) frequency and p-value (two-sided Fisher’s exact test) is indicated if significant (p<0.01). Comparisons using <100 overlapping peaks are denoted with a hash mark (#). (H) Stacked bar plot showing the percent of genes in each transcriptional reactivation cluster that retained all, some, or none of the three bookmarks (H3K27ac, TBP, ATAC-seq). See also Figure S3 and Tables S2, S6
