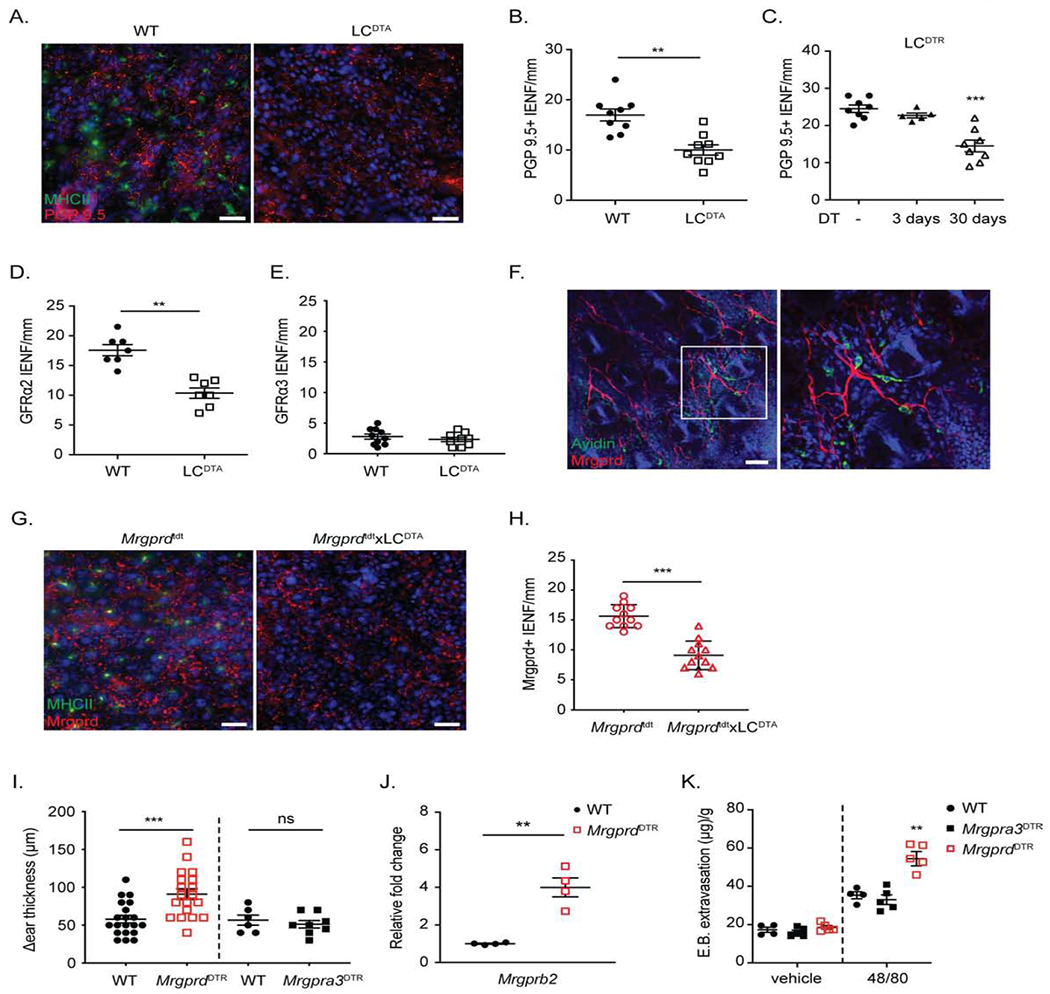
Figure 2. Epidermal MrgprD-expressing nerve endings are reduced by long-term LC ablation.

(A) Representative immunofluorescent microscopic image of an epidermal whole-mount from WT and LCDTA mice ears stained for MHC-II to identify LC (green) and PGP 9.5 to identify neuron (red). (B) Quantification of intra-epidermal nerve fiber number (IENF) from transverse skin sections stained with PGP 9.5 from LCDTA and littermate (WT) controls. (C) As in B except IENF were quantified from LCDTR mice treated with PBS (−) or with DT for 3 days or 30 days. (D, E) Quantitative analysis of IENF from transverse section stained with GFRα2 (D) or GFRα3 (E) from WT and LCDTA mice. (F) Representative confocal image of MrgprdTdT skin whole mount to identify MC (green) and MrgprD-expressing neurons (red). (G) Representative epidermal whole-mounts from the ears of MrgprdTdT and MrgprdTdTxLCDTA mice stained for MHC-II to identify LC (green) are shown. (H) Quantification of IENF of MrgprD+ nerve from transverse skin sections from MrgprdTdT and MrgprdTdT x LCDTA mice. (I) Ear thickness at 6 hours following application of 1% croton oil in MrgprdDTR or Mrgpra3DTR mice treated with control PBS or DT is shown. (J) Mrgprb2 mRNA expression in FACSorted dermal mast cells isolated from naive PBS or DT treated MrgprdDTR mice is shown. (K) Quantification of Evans blue dye 20 mins after challenged with vehicle or compound 48/80 in WT mice or DT treated Mrgpra3DTR, MrgprdDTR mice. Each symbol represents data from an individual animal. Results are represented as mean ± SEM from 2-3 individual experiments with cohorts of n=3-4. Significance was calculated using unpaired Student’s t test (B, D, E, H, I, J) and one-way ANOVA (C, K). **p < 0.01, ***p < 0.001; n.s, no significant difference. Scale bars represent 20 μm in A, G; and 50 μm in F.
