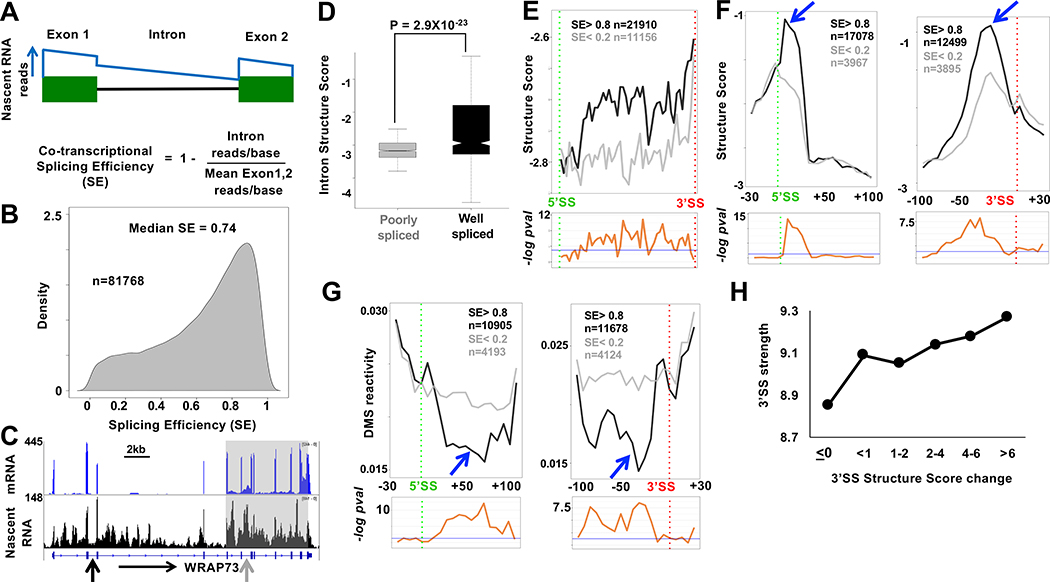
Figure 3: RNA structural signature of efficient co-transcriptional splicing.
A. Calculation of co-transcriptional splicing efficiency, SE by the Fcov method (see Methods). The blue line represents idealized nascent RNA coverage.
B. Probability density plot of SE from tNET-seq of HEK293 WT Amr pol II cells based on three biological replicates for introns with ≥1 read/bp and/or ≥3 reads/bp across both flanking exons. Introns with standard deviation > 0.2 were removed. See Table S1.
C. mRNA and tNET-seq showing co-transcriptionally well-spliced (black arrow SE=.91) and poorly spliced (gray arrow SE=.009) introns and clustering of introns (grey box) with coordinated splicing (SE < 0.4) (see Fig. S4G).
D. Well-spliced introns (SE > 0.8, n=5739) are more structured than poorly spliced introns (SE < 0.2, n=1001). Mean Structure Score per nucleotide for introns >100bases with coverage >9 reads for at least 10% of the length of the intron. P value determined by unpaired t-test
E. Structure Score across well-spliced (SE>0.8) and poorly spliced (SE<0.2) introns >200 bases long (50 bins). Putative protein footprint regions were removed. Bottom panels −loge adjusted P values per bin (unpaired Wilcoxon-rank test). Blue line: −loge 0.05.
F, G. Efficient co-transcriptional splicing associated with peaks of intronic structure (blue arrows) and steep structural transitions at 5’ and 3’SS’s. Metaplots (5 base bins) of Structure Score, F, and DMS reactivity, G, at well-spliced (SE> 0.8) and poorly spliced (SE < 0.2,) introns. FDR values as in E. See Fig. S5.
H. Correlation between median calculated 3’ SS strength (Yeo and Burge, 2004) and experimentally determined structural transitions across 3’ splice sites. (Mean Structure Score of bases −1 to −100 minus bases +1 to +40 relative to 3’SS, n=18455).

