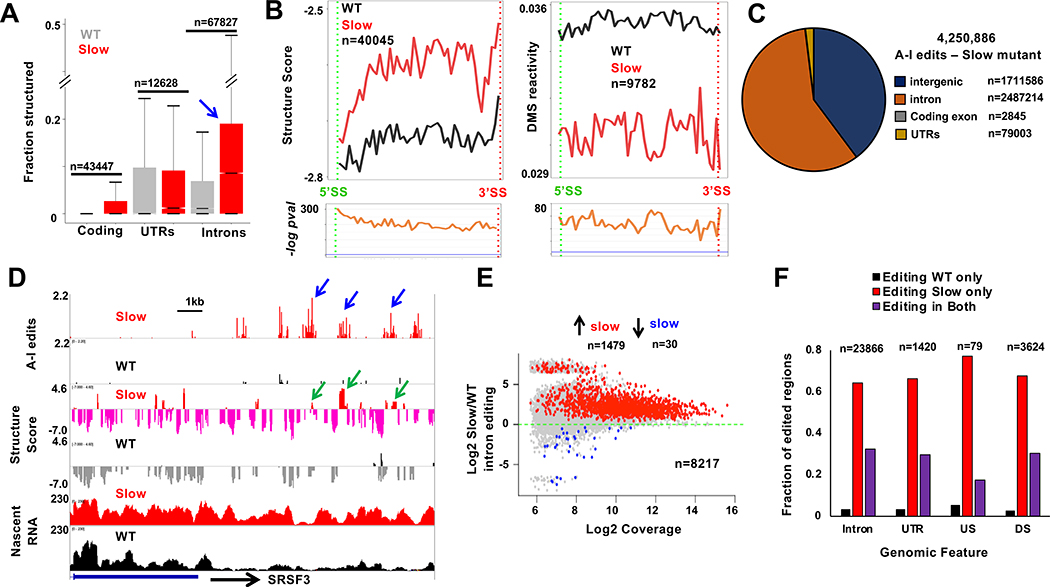
Figure 4. Slow transcription extensively modifies nascent RNA structure and A-I editing.
A. Slow transcription increases nascent RNA structure. The fractions of bases (minimum 15 reads/base) with Structure Score >1.9 are plotted in cells expressing WT and slow (R749H) pol II (see Fig. S6A).
B. Metaplots as in 3E showing increased structure throughout introns transcribed by slow pol II.
C. A-I edits in nascent RNA from HEK293 expressing slow pol II. Note increased editing relative to WT pol II (Fig. 1C).
D. A-I editing, Structure Score and nascent RNA coverage downstream of SRSF3. Note elevated editing (blue arrows) and Structure Score (green arrows) in the slow pol II mutant.
E. Slow transcription increases intronic A-I editing independent of expression level. Introns contain >3 edited sites in WT or slow pol II mutant in three replicates. Red and blue dots have FDR<0.05 and fold change >1.3. See Table S3.
F. A-I editing in nascent RNA (see Methods) in introns, UTRs, and intergenic regions upstream (US) and downstream (DS) of genes. Note de novo editing (red bars) with slow pol II.

