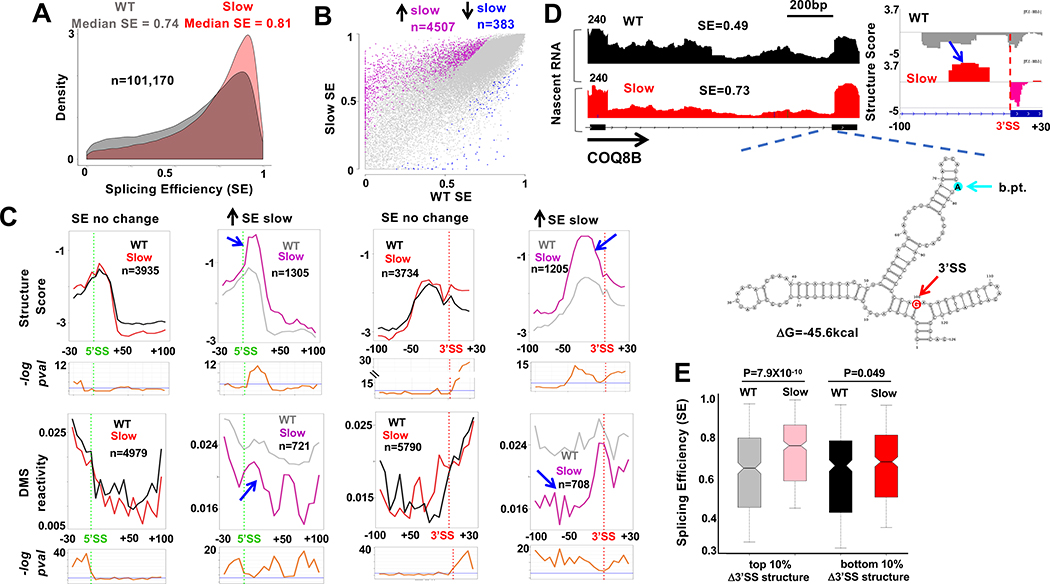
Figure. 5. Slow transcription specifically alters RNA structure at splice sites with increased co-transcriptional splicing.
A. Slow transcription increases co-transcriptional splicing. Probability density plot of SE (Fig. 3A, n=3) in HEK293 expressing WT and slow pol II.
B. Slow transcription preferentially increases co-transcriptional splicing of a subset of introns. Pink and blue points indicate altered SE (FDR<0.05, >1.25-fold change) in slow vs WT pol II.
C. Metaplots (5 base bins) of Structure Score and DMS reactivity across splice sites of introns whose SE is increased (grey and pink) or unaffected (black and red) by slow transcription. Note elevated structure and steeper 5’ and 3’ SS steps where splicing is stimulated by slow transcription (blue arrows). See Fig. S6C, D.
D. Elevated RNA structure (blue arrow) at the 3’ SS of an intron (chr19:41,209,740–41,211,039) where SE is increased by slow pol II. tNET-seq, Structure Score and predicted RNA folding around the 3’SS and branch point (b.pt.). See Fig. S7.
E. Elevated 3’SS structure in the slow pol II mutant predicts increased co-transcriptional splicing. Change in Structure Score of bases −10 to −70 relative to 3’SS between slow and WT pol II was ranked for 3994 introns and SE of the top and bottom 10% is plotted. Note increased SE of introns with the greatest increase in 3’SS structure.

