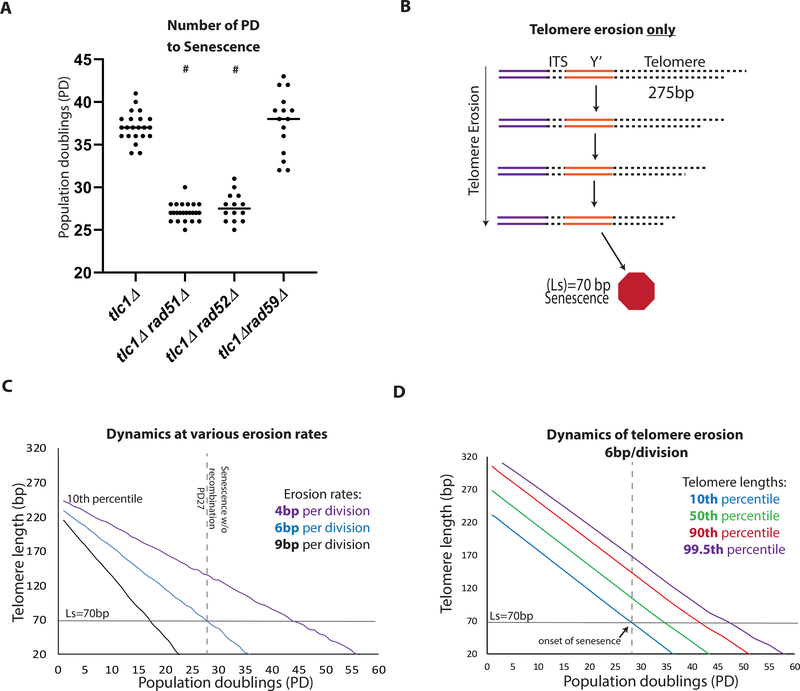
Figure 2. Dynamics of telomere erosion and onset of senescence in tlc1Δ strains.
(A) Scatter plot of the number of Population Doublings (PD) that occur for the culture to become senescent (defined by no further cell divisions). # indicates a statistically significant difference of the PD as compared to tlc1Δ (Mann-Whitney, test P=<0.0001).
(B-D) Computational modeling of telomere erosion (modeling telomere dynamics in HR deficient cells following elimination of telomerase).
(B) Schematic for model of telomere erosion. (ITS= interstitial telomere sequence, Y’= Y’ region).
(C) Modeling the decrease of the 10th percentile of telomere length at various erosion rates.
(D) Modeling the entire distribution of telomere lengths with telomere erosion at 6bp/division (div). The time of senescence was defined by the 10th percentile line crossing the Ls threshold.

