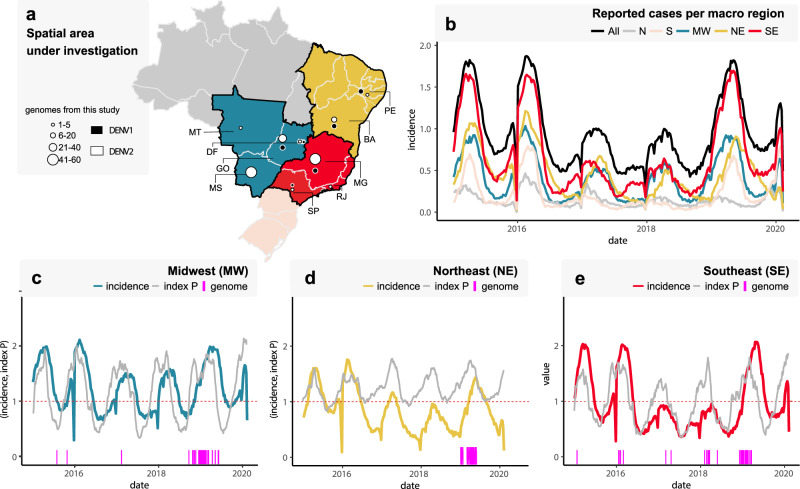
Fig. 1. Spatial and temporal distribution of reported dengue cases in Brazil, 2015–2020.
a Map of Brazil showing the number of DENV1 and DENV2 new sequences by region and state. DF = Federal District, BA = Bahia state, GO = Goiás state, MT = Mato Grosso state, MS = Mato Grosso do Sul state, MG = Minas Gerais state, PE = Pernambuco state, RJ = Rio de Janeiro state, SP = São Paulo state. The color and size of the circles indicates the number of new genomes generated in this study (black = DENV1, white = DENV2). b Weekly notified dengue cases normalized per 100 K individuals per region in 2015-2020 (until EW06). Epidemic curves are colored according to geographical macro region: SE = Southeast, NE = Northeast, MW = Midwest, N = North, S = South. c–e Time series of weekly reported cases normalized per 100 K individuals and daily mosquito-viral suitability measure (index P) in the three macro regions for which new sequences were generated: MW = Midwest (C), NE = Northeast (D), and SE = Southeast (E). The index P of each region is obtained using average climatic data for the three largest urban centers in each region. Purple bars highlight the dates of sample collection of the genomes generated here. b–e Incidence (cases per 100 K population) is presented in log10 for visual purposes. The initial map of Brazilian regions was obtained from the R package “get_brmap” (available at: https://rdrr.io/cran/brazilmaps/man/get_brmap.html). Source data are provided as a Source Data file.

