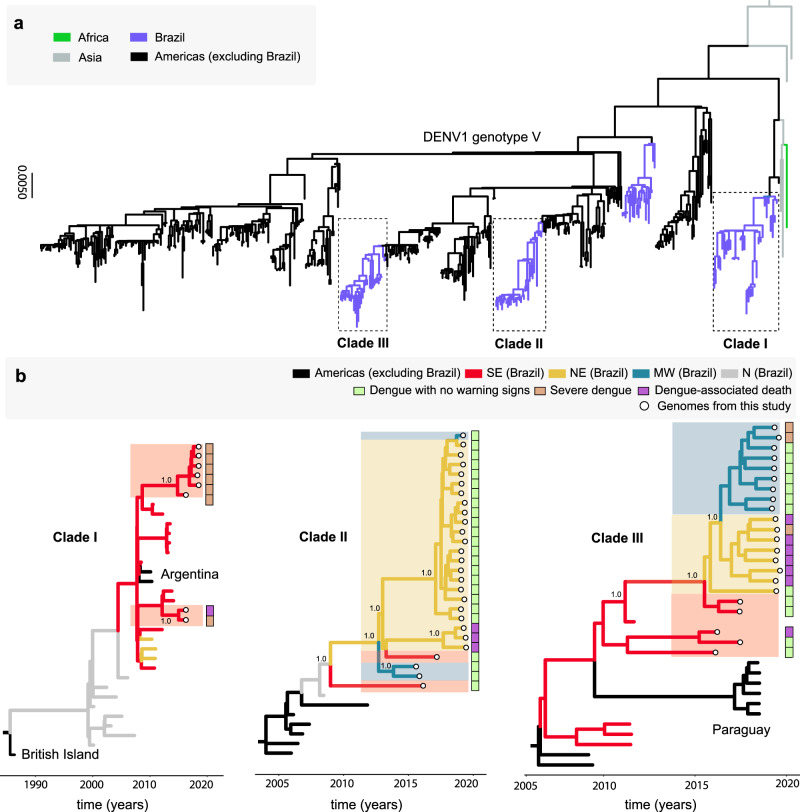
Fig. 2. Phylogenetic analysis of DENV1-V in Brazil.
a Maximum likelihood (ML) phylogenetic analysis of 57 complete genome sequences from DENV1 generated in this study plus 444 publicly available sequences from GenBank. The scale bar is in units of nucleotide substitutions per site (s/s) and the tree is mid-pointed rooted. Colors represent different sampling locations. b Time-scaled phylogeographic tree of Clade I (including eight new sequences plus 25 GenBank sequences), Clade II (including 27 new sequences plus seven GenBank sequences), and Clade III (including 22 new sequences plus 12 GenBank sequences). Colors represent different sampling locations (SE Brazil = Brazilian Southeast, NE Brazil = Brazilian Northeast, MW = Brazilian Midwest, N Brazil = Brazilian North). Tip circles represent the genome sequences generated in this study; colored sidebars represent the dengue clinical classification for each sequenced sample.

