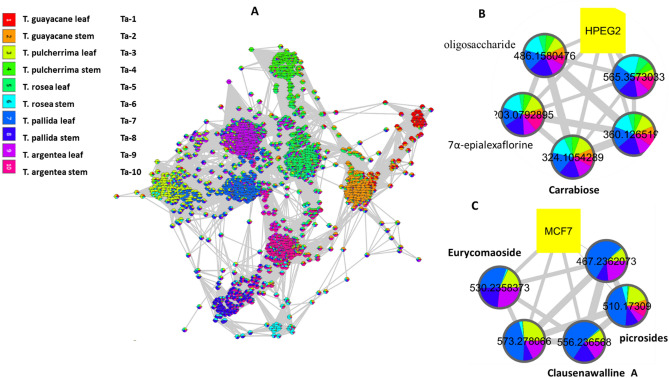
Figure 3.
Molecular correlation analysis (Cytoscape software, version 3.4.0). (A) Whole molecular correlation analysis showing molecular interactions/grouping; (B) extracted analysis showing molecules highly correlated with HepG2 cytotoxicity; (C) extracted analysis showing molecules highly correlated with MCF-7 cytotoxicity. Nodes are labeled with the molecular weights of the compounds that they represent. The width of the edges connecting nodes is proportional to the strength of interactions.

