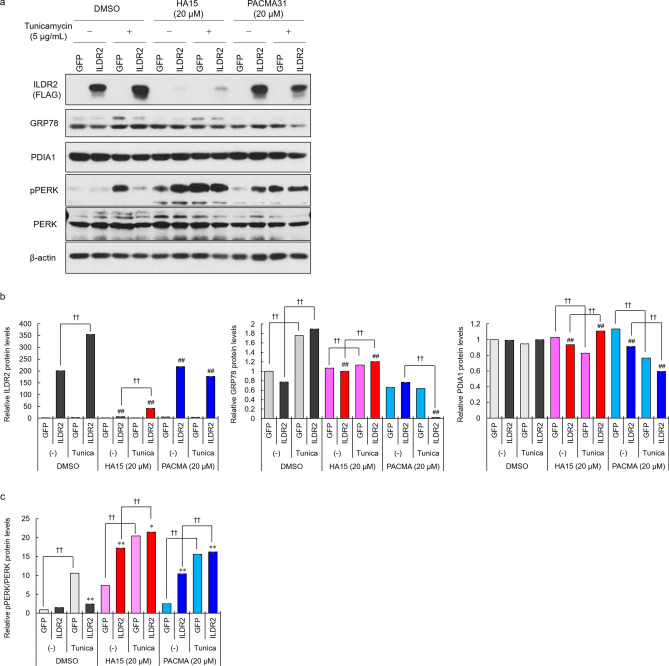
Figure 3.
Changes in ILDR2 expression levels affect PERK activation under ER stress. (a) MIN6 cells were infected with either GFP or FLAG-tagged ILDR2 adenovirus. After 48 h infection, cells were incubated with or without HA15, PACMA31 and tunicamycin for 6 h, and whole cell lysates were prepared and subjected to western blotting using anti-FLAG, anti-GRP78, anti-PDIA1, anti-pPERK, anti-PERK, and anti-β-actin antibodies. n = 3 per group. (b) Quantification of relative protein levels for ILDR2, GRP78, and PDIA1 by western blotting. The data were normalized with β-actin levels. n = 3 per group, †p < 0.05, ††p < 0.01 vs. Tunicamycin (-); #p < 0.05, ##p < 0.01 vs. DMSO (c) Relative pPERK expression. Data were normalized to total PERK levels. n = 3 per group, *p < 0.05, **p < 0.01 vs. GFP; †p < 0.05, ††p < 0.01 vs. Tunicamycin (-). Statistical analysis data were presented in Supplementary Table 3.

