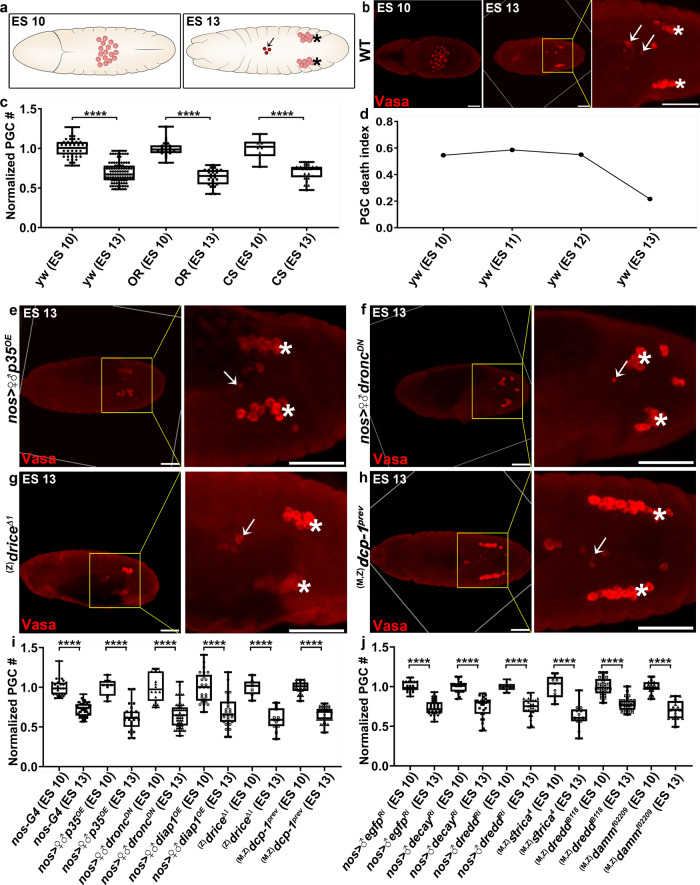
Fig. 1. PGCs die through a caspase-independent pathway.
a Dorsal view illustrations of Drosophila embryos at ES 10 (left) and ES 13 (right). During these stages, PGCs (red) migrate from the midline region (ES 10) to the gonadal sites (asterisks; ES 13). About 30% of the PGCs fail to migrate and undergo cell death (arrow). b, e–h Representative images of embryos of the indicated genotypes and embryonic stages stained to visualize the PGCs (Vasa; red). The outlined areas (yellow squares) are magnified in the right panels, presenting the midline region with the dying PGCs (arrows pointing at highly condensed dying PGCs with reduced Vasa signal; asterisks indicate gonadal PGCs). Note that since the demolition process is not fully synchronous, some highly condensed dying PGCs can still be visualized in the midline region of ES 13 embryos. Scale bars 50 μm. c, i, j Quantification of PGC death levels in embryos of the indicated genotypes by normalizing the total PGC number in each individual embryo at ES 10 and ES 13 to the average PGC number at ES 10 (the highly condensed dying PGCs detected at ES 13 are considered dead cells and thus omitted from our calculations). All data points, including outliers, were presented in box plot format where the minimum is the lowest data point represented by the lower whisker bound, the maximum is the highest data point represented by the upper whisker bound, and the center is the median. The lower box bound is the median of the lower half of the dataset while the upper box bound is the median of the upper half of the dataset. Each dot corresponds to the number of PGCs in a single embryo to reflect n number, where n = number of examined biologically independent embryos. ****p < 0.0001, Student’s t-test, one-sided distribution. d PGC death index reflects the frequency of detection of morphologically condensed/distorted dying PGCs at the relevant embryonic stage. b, c Regardless of the variations in the number of PGCs at ES 10, which depends on the fly strain background (shown are 3 different WT strains, yw, OR, and CS, containing, at ES 10, 27 ± 3, 34 ± 4, and 33 ± 3 PGCs on average, respectively), the relative percentage of the aberrantly migrating midline PGCs undergoing cell death remains constant (i.e. ~30%). e–j PGC death proceeds in the absence of the apoptotic and non-apoptotic caspases. ♀, female; ♂, male; (M) and (Z), maternal and zygotic mutant embryos, respectively.

