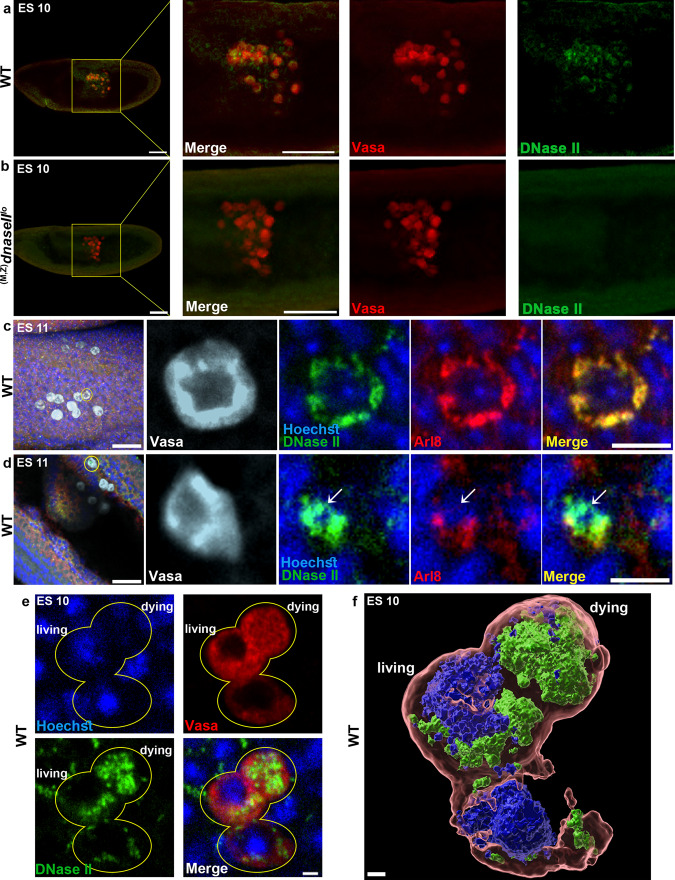
Fig. 4. DNase II is released from the lysosomes and translocates to the nucleus in dying PGCs.
a,b Representative images of ES 10 WT (a) and dnaseII mutant (b) embryos stained to visualize the PGCs (Vasa; red) and DNase II (green). Note the lack of DNase II signal in the PGCs in the dnaseII mutant, as opposed to the strong signal in the WT counterparts. The outlined area (yellow square) is magnified in the right panels. Scale bars, 50 μm. c, d Representative images of ES 11 WT embryos stained to visualize the PGCs (Vasa, white), DNase II (green), lysosomes (Arl8, red), and DNA (Hoechst, blue). Scale bars, 30 μm. The outlined cells (yellow circles) are magnified in the right panels. Scale bars, 10 μm. Note that in living PGCs, DNase II is unequivocally localized to the lysosomes (c), whereas at early cell death stages, DNase II is released from the lysosomes (d). e, f DNase II translocation to the nucleus in the dying PGCs is associated with DNA fragmentation. Living and dying PGCs in an ES 10 WT embryo (e) and a 3D rendering of this image (f) stained to visualize the PGCs (Vasa, red), DNase II (green), and the DNA (Hoechst, blue). Note the nuclear localization of DNase II and the associated dramatic reduction in the intensity of the Hoechst staining (typical of highly fragmented DNA) in the dying PGC. See also the accompanying Supplementary Movie 1 for full 3D visualization of the image presented in (f). Scale bars in e 2 μm; f 1 μm.

