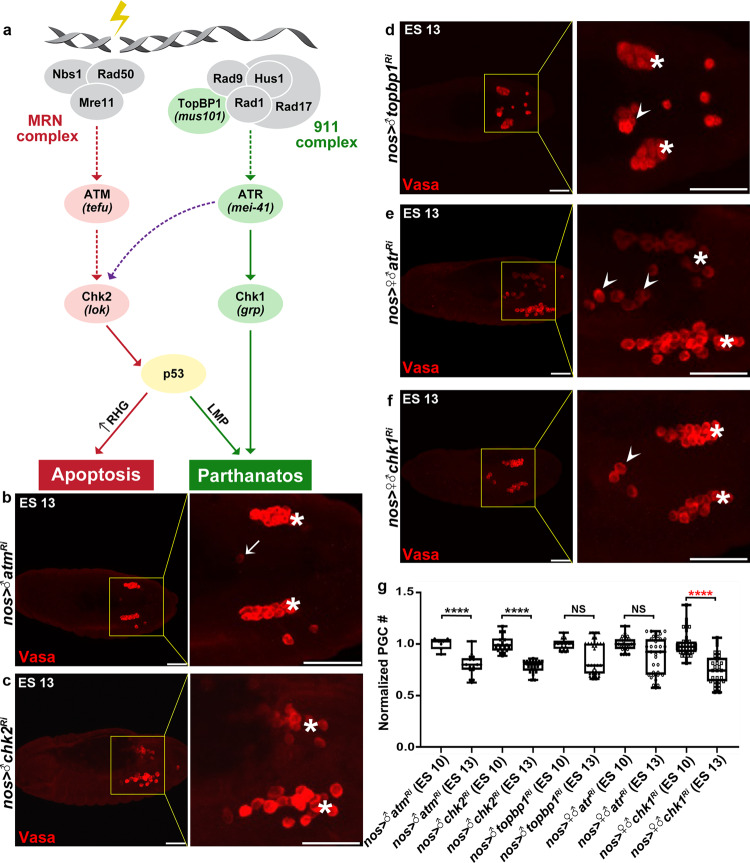
Fig. 6. Inactivation of the ATR/Chk1 branch of the DDR attenuates PGC death.
a Illustration of the two branches of the DDR pathway induced by DNA damage. Tested components for effects on PGC death are indicated in pink (for no effect) and green (for having an effect). Untested/unconfirmed components are in gray. Dashed lines indicate suggested interactions based on data from mammalian systems or when direct regulation was not observed in Drosophila. In brackets are the names of the Drosophila genes if different from the names of the mammalian homologs. Note that for the sake of simplicity, only parthanatos is mentioned as a process downstream of Chk1. b–f Representative images of ES 13 embryos with PGC-specific knockdowns of the indicated DDR pathway genes (corresponding to the cartoon model in a), stained and presented as in Fig. 1b. PGCs (Vasa; red). Dying PGCs are indicated by arrows; ectopically surviving PGCs by arrowheads; gonadal PGCs by asterisks. Whereas PGC death normally proceeded upon knockdown of components in the ATM/Chk2 branch of the DDR (b, c), knockdown of components in the ATR/Chk1 branch of the DDR attenuated PGC death (d–f). Scale bars, 50 μm. g Quantifications of PGC death levels in embryos corresponding to the genotypes in (b–f). All data points, including outliers, were presented in box plot format where the minimum is the lowest data point represented by the lower whisker bound, the maximum is the highest data point represented by the upper whisker bound, and the center is the median. The lower box bound is the median of the lower half of the dataset while the upper box bound is the median of the upper half of the dataset. Each dot corresponds to the number of PGCs in a single embryo to reflect n number, where n = number of examined biologically independent embryos. ****p < 0.0001; NS, non-significant; Student’s t-test, one-sided distribution. Added information about the red asterisks is in the main text.

