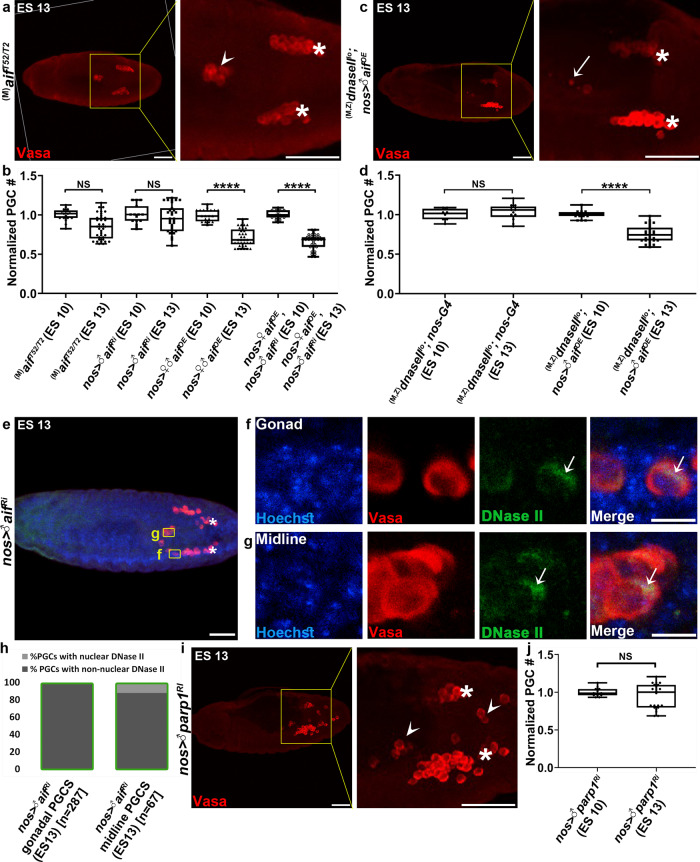
Fig. 7. AIF and PARP-1 mediate PGC death.
a Maternally deposited aif is required cell autonomously for PGC death. A representative image of an embryo with maternal hypomorphic allele combination of aif mutants stained and presented as in Fig. 1b. PGCs (Vasa; red). An arrowhead pointing at ectopically surviving midline PGCs. Asterisks indicate gonadal PGCs. Scale bars, 50 μm. b Quantification of PGC death levels in aif mutant, knockdown, and overexpressing embryos. All data points, including outliers, were presented in box plot format where the minimum is the lowest data point represented by the lower whisker bound, the maximum is the highest data point represented by the upper whisker bound, and the center is the median. The lower box bound is the median of the lower half of the dataset while the upper box bound is the median of the upper half of the dataset. Each dot corresponds to the number of PGCs in a single embryo to reflect n number, where n = number of examined biologically independent embryos. ****p < 0.0001; NS, non-significant; Student’s t-test, one-sided distribution. Note that while not inducing precocious PGC death when overexpressed in an otherwise WT background, OE of aif was able to oppose the block in PGC death caused by aif knockdown, confirming the validity of the aif RNAi and OE transgenes. c, d aif OE restores PGC death levels in embryos maternally mutant for the hypomorphic dnaseIIlo allele. Shown is a representative image of dnaseII mutant embryo, at ES 13, with PGC-specific aif OE (c) stained, presented, and annotated as in Fig. 1b. An arrow is pointing at a condensed dying PGC. Scale bar, 50 μm. Quantification of PGC death levels in the dnaseII mutant embryos with or without PGC-specific aif OE (d), calculated and presented as in (b). ****p < 0.0001; NS, non-significant; Student’s t-test, one-sided distribution. e–g Nuclear translocation of DNase II is attenuated in ectopically surviving aif knockdown PGCs. A representative image of an ES 13 embryo with PGC-specific aif knockdown stained to visualize the DNA (Hoechst; blue), PGCs (Vasa; red) and DNase II (green) (e), and magnifications of the areas outlined by yellow rectangles (f, g). Asterisks indicate gonadal PGCs. Scale bars in (e), 50 μm; (f, g) 10 μm. h Quantification of the percentage of gonadal and midline PGCs with nuclear versus non-nuclear DNase II localization in aif knockdown ES 13 embryos. Green column outline indicates that only living cells were counted. n number is shown in brackets where n = number of examined PGCs. i, j PARP-1 inactivation attenuates PGC death. Shown is a representative image of an ES 13 embryo with PGC-specific parp1 knockdown (i) stained, presented, and annotated as in Fig. 1b. Scale bars, 50 μm. Quantification of PGC death levels in embryos with PGC-specific parp1 knockdown (j), calculated and presented as in (b). NS, non-significant; Student’s t-test, one-sided distribution.

