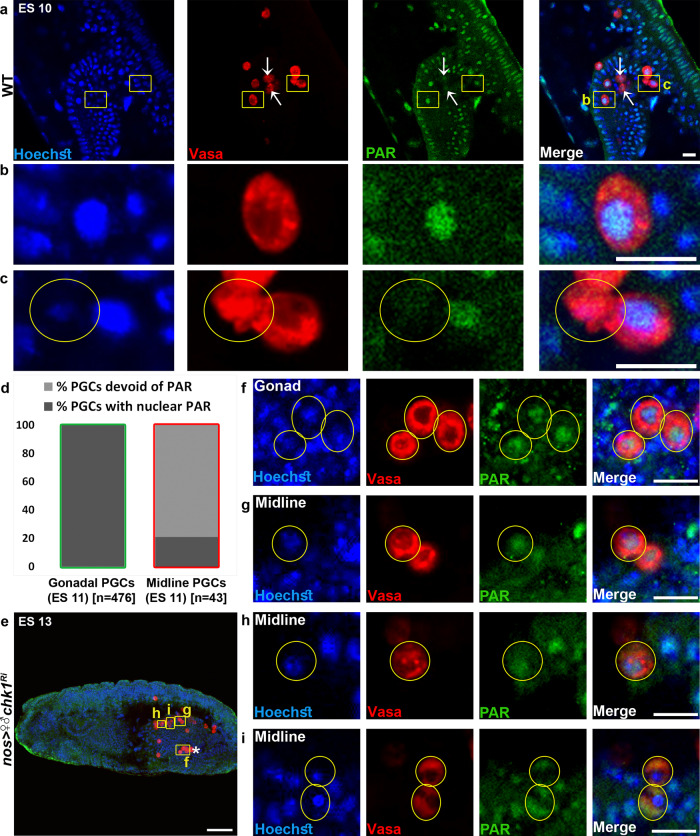
Fig. 9. PAR polymers are released to the cytoplasm during PGC death.
a–d Dying PGCs display no PAR polymers in the nucleus. A representative image of the midline region of an ES 10 WT embryo stained to visualize PAR (anti-PAR; green), PGCs (Vasa; red), and DNA (Hoechst; blue) (a), and magnifications of the areas outlined by yellow rectangles (b, c). Arrows are pointing at two dying PGCs with highly reduced levels of nuclear PAR. Note that the PAR polymers are predominantly localized in the nucleus of living (intact) PGCs, but are almost absent in dying PGCs (a condensed dying PGC is circled). Scale bars, 10 μm. Quantification of the percentage of gonadal and midline PGCs devoid of PAR signal or with nuclear PAR in WT ES 11 embryos (d). Green column outline indicates intact living cells, while red column outline indicates condensed and distorted dying PGCs. n number is shown in brackets where n = number of examined PGCs. e–i Ectopically surviving PGCs due to compromised DDR reveal the release of the PAR polymers from the nucleus to the cytoplasm. Shown is a representative image of an ES 13 embryo with PGC-specific chk1 knockdown (e) stained as in (a). An asterisk indicates gonadal PGCs. Magnifications of several areas outlined by yellow rectangles in (e) are presented in (f–i). Shown are gonadal PGCs (f) and an ectopically surviving midline PGC (g) predominantly displaying PAR in the nucleus (circled), an ectopically surviving midline PGC displaying both nuclear and cytoplasmic PAR (h; circled), and ectopically surviving midline PGCs displaying only cytoplasmic PAR (i; circled). Scale bars in e 50 μm, f–i 10 μm.

