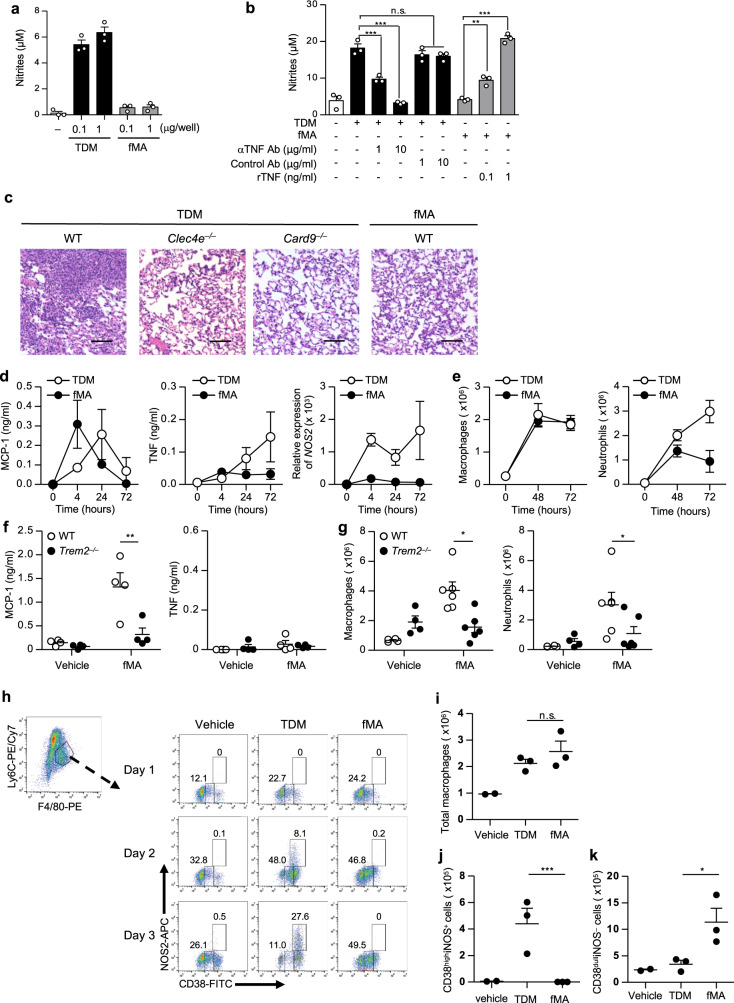
Fig. 5. Triggering of TREM2 by MA induces the permissive macrophages.
a, b BMDMs were stimulated for 24 h with the indicated amount of TDM or fMA in the presence of 10 ng/ml IFN-γ (a), 1 μg of TDM with or without the indicated amounts of a TNF-blocking antibody (αTNF Ab) or an isotype-matched control antibody (Control Ab) (b), or 1 μg of fMA with or without recombinant TNF (rTNF) (b). NO production was determined by Griess assay. Data represent as the mean ± SEM of triplicate assays from three independent experiments. The statistical significance was calculated by one-way ANOVA followed by Bonferroni’s test. **p < 0.01, ***p < 0.001, n.s. not significant. c Representative images of the hematoxylin and eosin-stained lungs from WT, Clec4e−/−, or Card9−/− mice at day 7 after intravenous injection of 50 μg TDM or 250 μg fMA emulsion. The images are representative of two independent experiments. Scale bars: 0.1 mm. d–f Peritoneal lavages were collected at 4, 24, and 72 h after intraperitoneally injection of 500 μg fMA or 100 μg TDM emulsion to WT mice (n = 4). MCP-1 and TNF concentrations in the lavages were measured by ELISA, and Nos2 mRNA levels were measured by quantitative RT-PCR. e Flow cytometric analysis of peritoneal neutrophils (CD11b+Ly6G+F4/80−) and monocyte-derived macrophages (CD11b+Ly6G−F4/80low SPMs) from WT mice (n = 4) at 48 and 72 h post injection of MA or TDM emulsions as in d. f, g WT or Trem2−/− mice were injected intraperitoneally with fMA or control (vehicle) emulsion. The concentrations of MCP-1 (control, n = 4; fMA, n = 6; at 4 h) and TNF (n = 4; at 72 h) in the peritoneal lavages was measured by ELISA (f). Peritoneal exudate cells (n = 4; at 72 h) was analyzed as in e and g. h–k WT mice were injected intraperitoneally with TDM, fMA, or control (vehicle) emulsion, and infiltrated macrophages at days 1, 2, and 3 were analyzed by flow cytometry for the expression of CD38 and iNOS (h). The numbers of total recruited monocyte-derived macrophages (CD11b+Ly6C+F4/80+) (i), the M1 macrophages (CD11b+Ly6C+F4/80+CD38highNOS+) (j), and permissive macrophages (CD11b+Ly6C+F4/80+CD38dullNOS−) (k) at day 3 are shown. Data in d–k represent as the mean ± SEM from at least three independent experiments. The statistical significance was calculated by two-way ANOVA followed by Bonferroni’s test (f–g) or by two-tailed unpaired t test (i–k). *p < 0.05, **p < 0.01, ***p < 0.001, n.s. not significant. Source data are provided as a Source data file.

