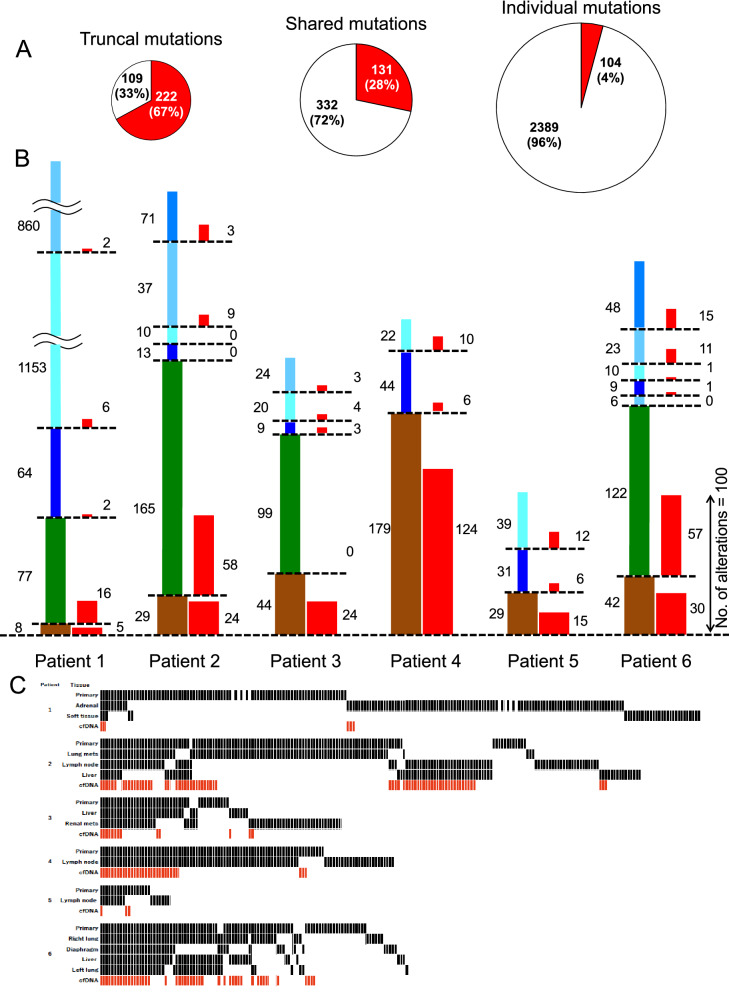
Figure 2.
Differences in the rates of genetic alteration detection in cfDNA among truncal, shared and individual alterations. (A) The pie charts show the differences in the number of genetic alterations detected in all 6 patients combined according to the mutation type (truncal, shared or individual). The values represent the numbers of genetic alterations. The red colors of the charts represent the number of genetic alterations both in cfDNA and tDNA. White represents only those in tDNA. The detection rate in cfDNA was highest for individual mutations and lowest for truncal mutations. (B) The figures show the total number of genetic alterations in each tumor sample of each patient. The height of each column represents the proportion of genetic alterations detected, and the total column height represents the total number of genetic alterations in each patient. The brown bars represent the genetic alterations detected in all tumor lesions (truncal), green bars represent the genetic alterations detected in more than one but not all lesions (shared), and the blue bars represent the genetic alterations detected in only one lesion (individual). The red bars represent the corresponding alterations detected in cfDNA. (C) The heatmaps were constructed using functional alterations. One line corresponds to one genetic alteration. Abbreviations: cfDNA, cell-free DNA.

