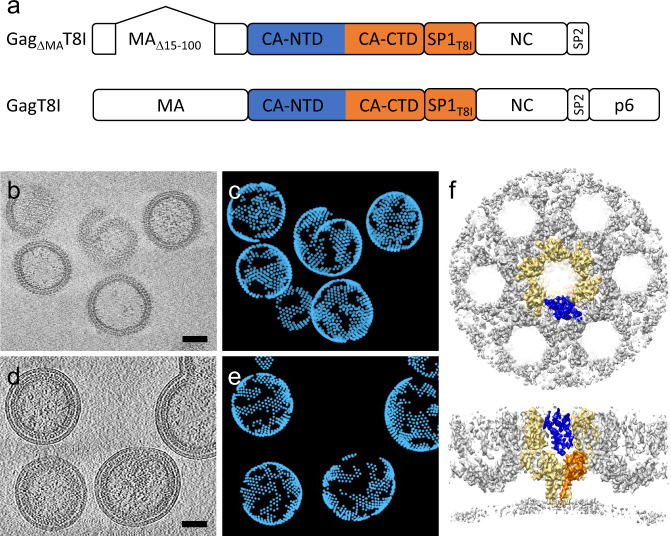
Fig. 1. CryoET and subtomogram averaging of Gag T8I assemblies and VLPs.
a Organization of the two constructs used for sample production: GagΔMAT8I, used for Gag assemblies made in E. coli cells; and GagT8I, used for VLP production in HEK293T cells. Both constructs bear the T8I mutation in the SP1 region (T371I in Gag sequence). b, c Purified GagΔMAT8I assemblies from E. coli cells are shown in a representative tomographic slice (b) and emClarity template matching result (c). d, e Purified GagT8I VLPs produced in HEK293T cells shown in a representative tomographic slice (d) and emClarity template matching result (e). f Subtomogram average of GagΔMAT8I assemblies in an extended lattice, shown in top and side views. The central GagΔMAT8I hexamer is highlighted in yellow and within which a monomer is highlighted in blue (CANTD) and orange (CACTD-SP1). Tomographic slices are 8 nm thick. Scale bars are 50 nm. Each point in (c) and (e) represents the position of a Gag hexamer.

